## Bar Chart: Algorithm Performance on Question Answering
### Overview
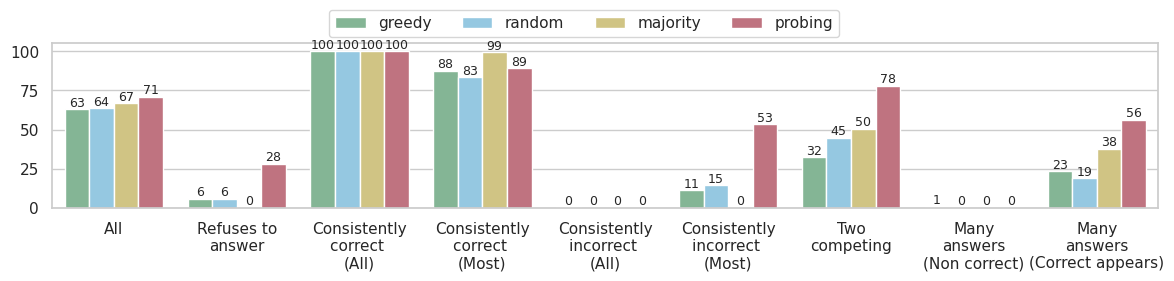
The image is a bar chart comparing the performance of four different algorithms ("greedy", "random", "majority", and "probing") on a question-answering task. The y-axis represents the percentage of correct answers, ranging from 0 to 100. The x-axis represents different categories of question answering scenarios, such as "All", "Refuses to answer", "Consistently correct", "Consistently incorrect", "Two competing answers", and "Many answers".
### Components/Axes
* **Title:** (Implicit) Algorithm Performance on Question Answering
* **Y-axis:** Percentage of correct answers (0 to 100, with increments of 25)
* **X-axis:** Categories of question answering scenarios:
* All
* Refuses to answer
* Consistently correct (All)
* Consistently correct (Most)
* Consistently incorrect (All)
* Consistently incorrect (Most)
* Two competing
* Many answers (Non correct)
* Many answers (Correct appears)
* **Legend:** Located at the top of the chart.
* Green: greedy
* Light Blue: random
* Tan: majority
* Rose: probing
### Detailed Analysis or ### Content Details
**1. All:**
* greedy: 63%
* random: 64%
* majority: 67%
* probing: 71%
**2. Refuses to answer:**
* greedy: 6%
* random: 6%
* majority: 0%
* probing: 28%
**3. Consistently correct (All):**
* greedy: 100%
* random: 100%
* majority: 100%
* probing: 100%
**4. Consistently correct (Most):**
* greedy: 88%
* random: 83%
* majority: 99%
* probing: 89%
**5. Consistently incorrect (All):**
* greedy: 0%
* random: 0%
* majority: 0%
* probing: 0%
**6. Consistently incorrect (Most):**
* greedy: 11%
* random: 15%
* majority: 0%
* probing: 53%
**7. Two competing:**
* greedy: 32%
* random: 45%
* majority: 50%
* probing: 78%
**8. Many answers (Non correct):**
* greedy: 1%
* random: 0%
* majority: 0%
* probing: 0%
**9. Many answers (Correct appears):**
* greedy: 23%
* random: 19%
* majority: 38%
* probing: 56%
### Key Observations
* All algorithms perform perfectly when the answer is consistently correct.
* The "probing" algorithm has the highest percentage when refusing to answer, and when there are two competing answers.
* The "probing" algorithm performs best when there are many answers and the correct answer appears.
* All algorithms perform poorly when consistently incorrect.
### Interpretation
The bar chart provides a comparative analysis of four question-answering algorithms across various scenarios. The "probing" algorithm appears to be more aggressive in providing answers, as it has a higher percentage of correct answers in complex scenarios like "Two competing" and "Many answers (Correct appears)", but also refuses to answer more often. The "greedy", "random", and "majority" algorithms show more consistent performance across different scenarios, but generally lower accuracy in complex situations. The fact that all algorithms score 0% when consistently incorrect (All) suggests that these scenarios are fundamentally difficult for all approaches.