## Bar Chart: Model Response Analysis
### Overview
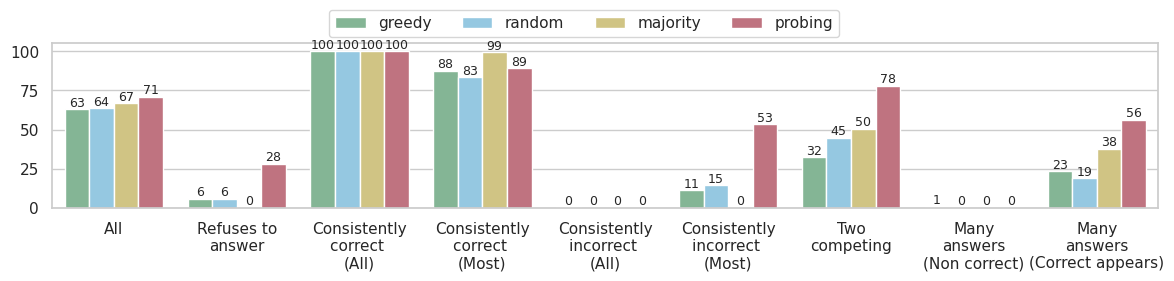
This bar chart compares the performance of four different models ("greedy", "random", "majority", and "probing") across several categories of response behavior. The categories represent different types of responses the models can give, ranging from refusing to answer to providing consistently correct or incorrect answers, and scenarios with competing or multiple answers. The y-axis represents a percentage, presumably indicating the frequency or proportion of responses falling into each category.
### Components/Axes
* **X-axis Title:** Response Type
* **Y-axis Title:** Percentage (%)
* **X-axis Categories:** "All", "Refuses to answer", "Consistently correct (All)", "Consistently correct (Most)", "Consistently incorrect (All)", "Consistently incorrect (Most)", "Two competing", "Many answers (Non correct)", "Many answers (Correct appears)"
* **Legend:** Located at the top-right of the chart.
* "greedy" (Green)
* "random" (Brown)
* "majority" (Gray)
* "probing" (Teal)
### Detailed Analysis
The chart consists of nine groups of bars, one for each response type category. Within each group, there are four bars, one for each model.
* **All:**
* greedy: Approximately 63%
* random: Approximately 64%
* majority: Approximately 71%
* probing: Approximately 67%
* **Refuses to answer:**
* greedy: Approximately 6%
* random: Approximately 6%
* majority: Approximately 0%
* probing: Approximately 28%
* **Consistently correct (All):**
* greedy: 100%
* random: 100%
* majority: 100%
* probing: 100%
* **Consistently correct (Most):**
* greedy: Approximately 88%
* random: Approximately 83%
* majority: Approximately 89%
* probing: Approximately 99%
* **Consistently incorrect (All):**
* greedy: 0%
* random: 0%
* majority: 0%
* probing: 0%
* **Consistently incorrect (Most):**
* greedy: Approximately 11%
* random: Approximately 15%
* majority: Approximately 0%
* probing: Approximately 53%
* **Two competing:**
* greedy: Approximately 32%
* random: Approximately 45%
* majority: Approximately 50%
* probing: Approximately 78%
* **Many answers (Non correct):**
* greedy: Approximately 1%
* random: Approximately 0%
* majority: Approximately 0%
* probing: Approximately 0%
* **Many answers (Correct appears):**
* greedy: Approximately 19%
* random: Approximately 23%
* majority: Approximately 38%
* probing: Approximately 56%
### Key Observations
* All models achieve 100% on "Consistently correct (All)".
* The "probing" model consistently exhibits the highest percentage in categories like "Refuses to answer", "Consistently incorrect (Most)", and "Two competing".
* The "majority" model performs well in "Consistently correct (Most)" and "Many answers (Correct appears)".
* The "greedy" and "random" models show relatively similar performance across most categories.
* The "majority" model has 0% in "Consistently incorrect (All)" and "Consistently incorrect (Most)".
### Interpretation
The data suggests that the "probing" model is more cautious and avoids providing answers when uncertain, leading to a higher rate of refusing to answer and a higher rate of incorrect responses when it does attempt an answer. The "majority" model appears to be more confident and provides answers more frequently, with a strong tendency towards correctness when it is consistent. The "greedy" and "random" models represent a middle ground, with more balanced performance across the categories. The chart highlights the trade-offs between different modeling approaches in terms of accuracy, confidence, and the handling of ambiguous or complex questions. The distinction between "All" and "Most" in the "Consistently correct/incorrect" categories suggests that the models can sometimes be correct or incorrect on a subset of instances, even if they generally exhibit consistent behavior. The "Two competing" and "Many answers" categories indicate scenarios where the models struggle to converge on a single, definitive answer.