# Technical Document Extraction: Line Graph Analysis
## Title
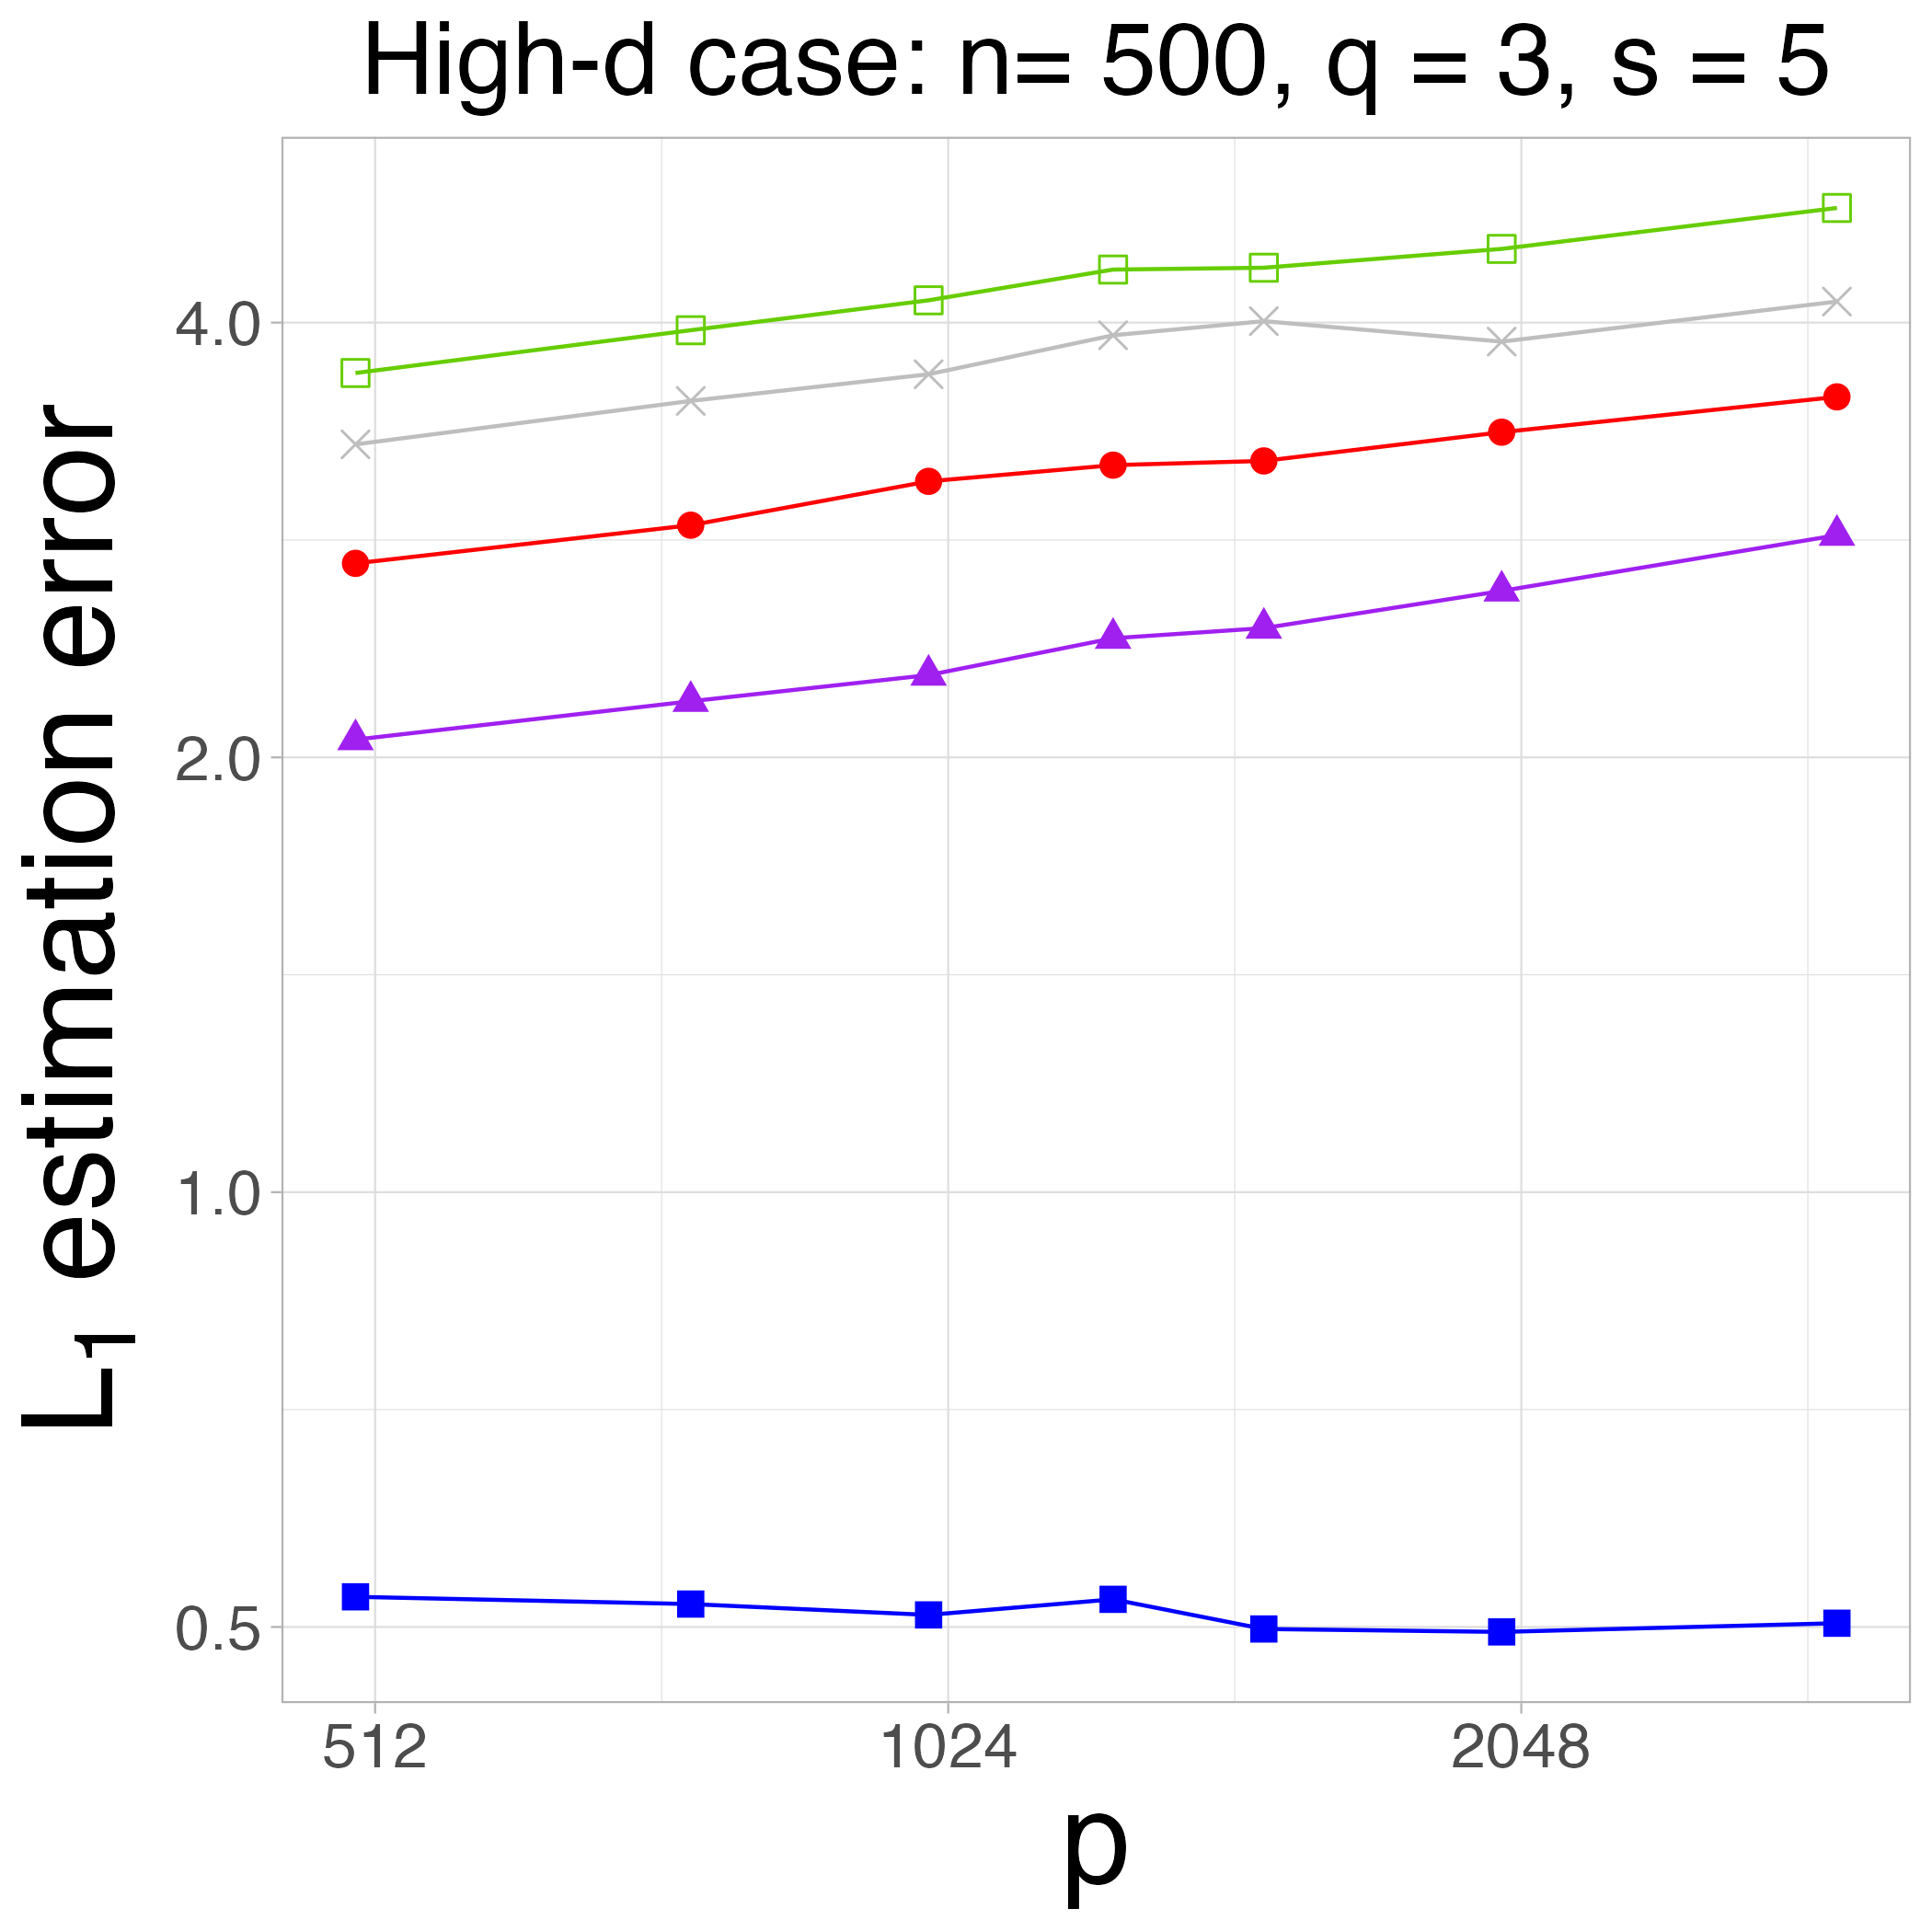
**High-d case: n = 500, q = 3, s = 5**
---
## Labels and Axis Titles
- **X-axis**: Labeled as `p` (horizontal axis).
- **Y-axis**: Labeled as `L₁ estimation error` (vertical axis).
---
## Legend
- **Location**: Top-right corner of the graph.
- **Entries**:
1. **Green squares** (Line 1)
2. **Gray crosses** (Line 2)
3. **Red circles** (Line 3)
4. **Purple triangles** (Line 4)
---
## Data Series and Trends
### Line 1: Green Squares
- **Trend**: Steadily increasing from left to right.
- **Data Points**:
- `p = 512`: ~3.8
- `p = 1024`: ~4.0
- `p = 2048`: ~4.1
- `p = 4096`: ~4.3
### Line 2: Gray Crosses
- **Trend**: Gradual increase with a slight dip at `p = 2048`.
- **Data Points**:
- `p = 512`: ~3.6
- `p = 1024`: ~3.8
- `p = 2048`: ~3.9
- `p = 4096`: ~4.1
### Line 3: Red Circles
- **Trend**: Consistent upward slope.
- **Data Points**:
- `p = 512`: ~3.2
- `p = 1024`: ~3.4
- `p = 2048`: ~3.6
- `p = 4096`: ~3.8
### Line 4: Purple Triangles
- **Trend**: Gradual increase with a slower rate of growth.
- **Data Points**:
- `p = 512`: ~2.0
- `p = 1024`: ~2.2
- `p = 2048`: ~2.4
- `p = 4096`: ~2.6
### Line 5: Blue Squares (Not in Legend)
- **Trend**: Flat line with minimal variation.
- **Data Points**:
- `p = 512`: ~0.5
- `p = 1024`: ~0.5
- `p = 2048`: ~0.5
- `p = 4096`: ~0.5
---
## Spatial Grounding
- **Legend Position**: Top-right corner.
- **X-axis Markers**: `512`, `1024`, `2048`, `4096`.
- **Y-axis Range**: `0.5` to `4.0` in increments of `0.5`.
---
## Component Isolation
### Header
- Title: `High-d case: n = 500, q = 3, s = 5`.
### Main Chart
- **Axes**:
- X-axis (`p`) with logarithmic spacing.
- Y-axis (`L₁ estimation error`) with linear scaling.
- **Lines**: Four primary lines (green, gray, red, purple) and one additional blue line (not in legend).
### Footer
- No explicit footer text.
---
## Critical Observations
1. **Legend Discrepancy**: The blue line (squares) is present in the graph but not included in the legend.
2. **Trend Consistency**: All lines except the blue one show increasing trends, with varying rates of growth.
3. **Data Point Accuracy**: Cross-referenced legend colors/markers with line placements to ensure alignment (e.g., green squares match Line 1).
---
## Conclusion
The graph illustrates the relationship between `p` and `L₁ estimation error` under specified parameters (`n = 500`, `q = 3`, `s = 5`). Key trends include steady increases for most lines, with the blue line remaining constant. The legend omits the blue line, which may indicate a labeling error or additional data series.