# Technical Document Extraction: Performance Comparison Chart
## 1. Image Overview
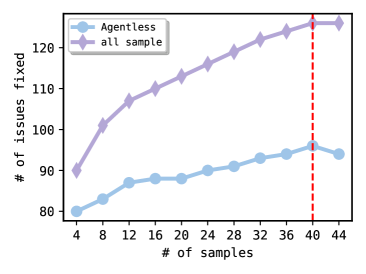
This image is a line graph comparing the performance of two methods ("Agentless" and "all sample") in terms of the number of issues fixed relative to the number of samples provided.
## 2. Component Isolation
### Header/Legend
- **Location:** Top-left corner (approx. [x=0.1, y=0.1] relative to the plot area).
- **Legend Items:**
- **Agentless:** Represented by a light blue line with circular markers.
- **all sample:** Represented by a light purple line with diamond markers.
### Main Chart Area
- **Y-Axis Label:** `# of issues fixed`
- **Y-Axis Markers:** 80, 90, 100, 110, 120
- **X-Axis Label:** `# of samples`
- **X-Axis Markers:** 4, 8, 12, 16, 20, 24, 28, 32, 36, 40, 44
- **Vertical Reference Line:** A dashed red vertical line is positioned at the x-axis value of **40**.
## 3. Data Series Analysis
### Series 1: "all sample" (Purple Diamonds)
- **Trend:** This line shows a consistent upward slope, indicating that as the number of samples increases, the number of issues fixed increases steadily. The rate of growth is higher than the "Agentless" method.
- **Estimated Data Points:**
| # of samples | Estimated Issues Fixed |
| :--- | :--- |
| 4 | ~90 |
| 8 | ~101 |
| 12 | ~107 |
| 16 | ~110 |
| 20 | ~113 |
| 24 | ~116 |
| 28 | ~119 |
| 32 | ~122 |
| 36 | ~124 |
| 40 | ~126 (Intersects red dashed line) |
| 44 | ~126 (Plateaus) |
### Series 2: "Agentless" (Blue Circles)
- **Trend:** This line also slopes upward but at a much shallower angle compared to "all sample." It shows a slight dip or plateau between 16 and 20 samples and a slight decrease after the 40-sample mark.
- **Estimated Data Points:**
| # of samples | Estimated Issues Fixed |
| :--- | :--- |
| 4 | ~80 |
| 8 | ~83 |
| 12 | ~87 |
| 16 | ~88 |
| 20 | ~88 |
| 24 | ~90 |
| 28 | ~91 |
| 32 | ~93 |
| 36 | ~94 |
| 40 | ~96 (Peak value, intersects red dashed line) |
| 44 | ~94 |
## 4. Key Observations
- **Performance Gap:** The "all sample" method consistently outperforms the "Agentless" method across all sample sizes shown.
- **Critical Point:** The red dashed line at **40 samples** highlights a point of interest where "all sample" reaches approximately 126 issues fixed, while "Agentless" reaches its peak of approximately 96 issues fixed.
- **Saturation:** The "all sample" method appears to begin plateauing after 40 samples, while the "Agentless" method shows a slight decline in performance after 40 samples.