## Line Graphs and Bar Charts: Model Performance Comparison
### Overview
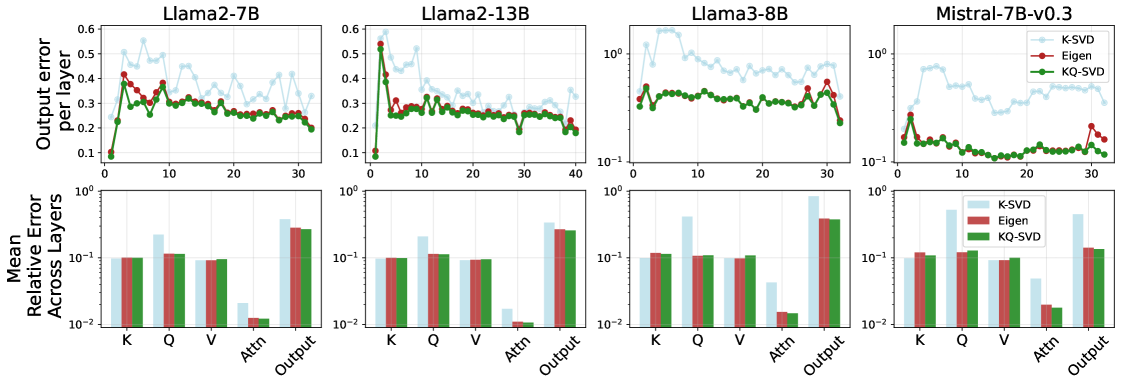
The image contains four sets of comparative graphs analyzing the performance of different neural network models (Llama2-7B, Llama2-13B, Llama3-8B, Mistral-7B-v0.3) across three optimization methods (K-SVD, Eigen, KQ-SVD). Each model has two subplots:
1. **Line Graph**: Output error per layer (0–40 layers)
2. **Bar Chart**: Mean relative error across components (K, Q, V, Attn, Output)
### Components/Axes
#### Line Graphs
- **X-axis**: Layer (0–40)
- **Y-axis**: Output error per layer (0–0.6)
- **Legend**:
- Blue: K-SVD
- Red: Eigen
- Green: KQ-SVD
- **Legend Position**: Top-left corner
#### Bar Charts
- **X-axis**: Components (K, Q, V, Attn, Output)
- **Y-axis**: Mean relative error (log scale: 10⁻²–10⁰)
- **Legend**: Same as line graphs (blue, red, green)
- **Legend Position**: Top-right corner
### Detailed Analysis
#### Line Graph Trends
1. **Llama2-7B**:
- K-SVD (blue) starts at ~0.5 error, fluctuates, and stabilizes near 0.3.
- Eigen (red) and KQ-SVD (green) begin lower (~0.3–0.4), with KQ-SVD showing the steepest decline to ~0.15 by layer 30.
- **Key Outlier**: K-SVD spikes to ~0.6 at layer 10.
2. **Llama2-13B**:
- All methods converge to ~0.2–0.3 error by layer 40.
- KQ-SVD (green) maintains the lowest error throughout.
3. **Llama3-8B**:
- K-SVD (blue) shows erratic fluctuations, peaking at ~0.5.
- Eigen (red) and KQ-SVD (green) stabilize near 0.1–0.2.
4. **Mistral-7B-v0.3**:
- K-SVD (blue) has a sharp spike at layer 10 (~0.5) but recovers.
- KQ-SVD (green) remains consistently below 0.2.
#### Bar Chart Trends
- **K Component**:
- KQ-SVD (green) consistently outperforms others (10⁻²–10⁻¹ range).
- Eigen (red) and K-SVD (blue) show similar performance (~10⁻¹).
- **Q Component**:
- KQ-SVD (green) achieves the lowest error (~10⁻²).
- Eigen (red) and K-SVD (blue) are comparable (~10⁻¹).
- **V Component**:
- KQ-SVD (green) dominates (~10⁻²).
- Eigen (red) and K-SVD (blue) overlap (~10⁻¹).
- **Attn Component**:
- KQ-SVD (green) is ~10⁻², while Eigen (red) and K-SVD (blue) are ~10⁻¹.
- **Output Component**:
- KQ-SVD (green) leads (~10⁻²).
- Eigen (red) and K-SVD (blue) are ~10⁻¹.
### Key Observations
1. **KQ-SVD Superiority**:
- Consistently achieves the lowest output error and mean relative error across all models and components.
- Stabilizes faster than other methods in line graphs.
2. **Eigen Competitiveness**:
- Matches KQ-SVD in some components (e.g., Q in Llama2-13B) but lags in others.
3. **K-SVD Limitations**:
- High initial errors and instability (e.g., Llama2-7B layer 10 spike).
4. **Model-Specific Behavior**:
- Llama2-13B and Mistral-7B-v0.3 show better convergence than Llama2-7B and Llama3-8B.
### Interpretation
The data demonstrates that **KQ-SVD** is the most effective optimization method for reducing both per-layer output error and mean relative error across components. Its consistent performance suggests robustness in handling model-specific complexities. **Eigen** serves as a viable alternative but lacks the consistency of KQ-SVD. **K-SVD** underperforms, particularly in early layers, indicating potential instability or suboptimal parameter tuning.
The trends imply that layer depth influences error dynamics: models with deeper architectures (e.g., Llama2-13B) exhibit smoother convergence, while shallower models (e.g., Llama2-7B) show more variability. The **Attn component** consistently exhibits higher errors, highlighting attention mechanisms as critical for optimization.
This analysis underscores the importance of method selection in neural network optimization, with KQ-SVD emerging as the optimal choice for minimizing errors in transformer-based models.