## Heatmap: Mean and Standard Deviation of Conductance
### Overview
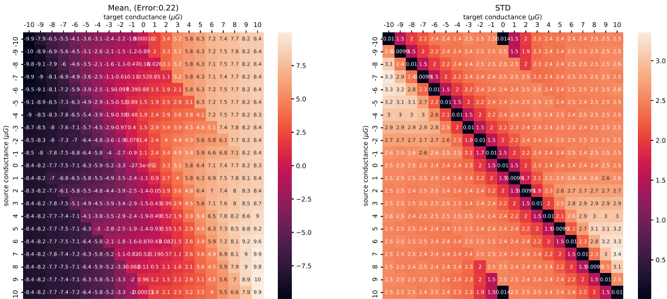
The image presents two heatmaps side-by-side. The left heatmap displays the mean conductance values, while the right heatmap shows the standard deviation (STD) of conductance. Both heatmaps share the same axes, representing "source conductance" and "target conductance" in micrograms (µG). The color intensity in each heatmap corresponds to the magnitude of the mean or STD value, as indicated by the color bars on the right of each heatmap.
### Components/Axes
**Left Heatmap (Mean):**
* **Title:** Mean, (Error:0.22)
* **X-axis:** target conductance (µG), ranging from -10 to 10 in integer increments.
* **Y-axis:** source conductance (µG), ranging from -10 to 10 in integer increments.
* **Color Bar:** Ranges from -7.5 (dark purple) to 8.4 (light orange).
**Right Heatmap (STD):**
* **Title:** STD
* **X-axis:** target conductance (µG), ranging from -10 to 10 in integer increments.
* **Y-axis:** source conductance (µG), ranging from -10 to 10 in integer increments.
* **Color Bar:** Ranges from 0.0009 (dark purple) to 3.4 (light orange).
### Detailed Analysis
**Left Heatmap (Mean):**
The values in the heatmap represent the mean conductance. The values are shown for each combination of source and target conductance.
* **Trend:** The mean conductance generally increases as both source and target conductance increase. The lower-left corner (negative source and target conductance) shows the lowest values (dark purple), while the upper-right corner (positive source and target conductance) shows the highest values (light orange).
* **Specific Values:**
* (-10, -10): -9.9
* (10, 10): 9.9
* (-10, 10): 8.4
* (10, -10): -8.4
* (0, 0): -2.7
**Right Heatmap (STD):**
The values in the heatmap represent the standard deviation of the conductance. The values are shown for each combination of source and target conductance.
* **Trend:** The standard deviation is highest along the diagonal (where source conductance equals target conductance) and decreases as you move away from the diagonal.
* **Specific Values:**
* (-10, -10): 0.01
* (10, 10): 0.01
* (-10, 9): 1.5
* (9, -10): 1.5
* (0, 0): 0.0009
### Key Observations
* **Mean Conductance:** The mean conductance is strongly correlated with both source and target conductance.
* **Standard Deviation:** The standard deviation is minimized when the source and target conductances are equal.
### Interpretation
The heatmaps illustrate the relationship between source and target conductance, showing how the mean and standard deviation of conductance vary with different combinations of these parameters. The mean conductance heatmap suggests a direct relationship between source/target conductance and the resulting mean conductance. The standard deviation heatmap indicates that the system is most stable (lowest standard deviation) when the source and target conductances are closely matched. The error associated with the mean is 0.22.