## Heatmap: Mean (Error 0.22) and Standard Deviation (STD) of Conductance Values
### Overview
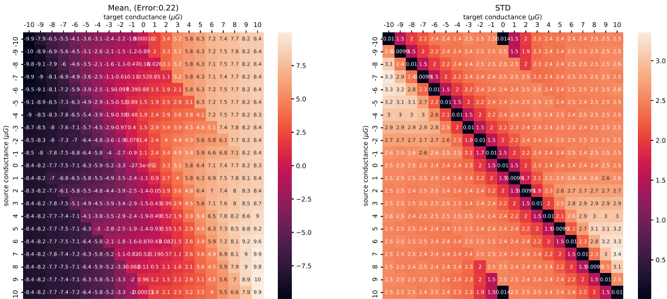
The image contains two side-by-side heatmaps. The left heatmap represents the **mean** of conductance values with an error margin of 0.22 μS, while the right heatmap shows the **standard deviation (STD)** of the same data. Both heatmaps use a color gradient to represent numerical values, with axes labeled in Chinese and English. The data is organized in a grid format, with rows and columns corresponding to "source conductance" and "target conductance" values.
---
### Components/Axes
#### Left Heatmap (Mean)
- **X-axis (Target Conductance)**: Labeled "target conductance (μS)" with values ranging from -10 to 10 in increments of 1.
- **Y-axis (Source Conductance)**: Labeled "source conductance (μS)" with values ranging from -10 to 10 in increments of 1.
- **Color Scale**: Dark blue (negative values) to red (positive values), with a legend on the right indicating:
- **-7.5**: Dark blue
- **-5.0**: Medium blue
- **-2.5**: Light blue
- **0.0**: White
- **2.5**: Light orange
- **5.0**: Orange
- **7.5**: Red
- **Embedded Text**: Numerical values (e.g., "-0.97", "-0.79") are embedded in each cell, representing the mean conductance values.
#### Right Heatmap (STD)
- **X-axis (Target Conductance)**: Same as the left heatmap, labeled "target conductance (μS)" with values from -10 to 10.
- **Y-axis (Source Conductance)**: Same as the left heatmap, labeled "source conductance (μS)" with values from -10 to 10.
- **Color Scale**: Dark blue (low STD) to light orange (high STD), with a legend on the right indicating:
- **-3.0**: Dark blue
- **-1.5**: Medium blue
- **0.0**: White
- **1.5**: Light orange
- **3.0**: Orange
- **Embedded Text**: Numerical values (e.g., "-0.01", "-0.01") are embedded in each cell, representing the standard deviation.
---
### Detailed Analysis
#### Left Heatmap (Mean)
- **Key Values**:
- Top-left cell: **-0.97** (dark blue)
- Bottom-right cell: **7.5** (red)
- Central region: Values cluster around **0.0** (white), with some positive values (e.g., **3.5**, **5.0**) in the upper-right quadrant.
- **Trends**:
- A gradient from negative (dark blue) to positive (red) values, suggesting a general increase in mean conductance as source and target conductances increase.
- The most extreme positive value (**7.5**) is in the bottom-right corner, indicating a strong correlation between high source and target conductances.
#### Right Heatmap (STD)
- **Key Values**:
- Top-left cell: **-0.01** (dark blue)
- Bottom-right cell: **3.0** (orange)
- Central region: Most values are **0.0** (white), with some variability in the upper-right quadrant (e.g., **1.5**, **2.5**).
- **Trends**:
- A gradient from low (dark blue) to high (orange) standard deviation, indicating greater variability in conductance measurements at higher source and target conductances.
- The most extreme positive value (**3.0**) is in the bottom-right corner, suggesting higher uncertainty in measurements at high conductances.
---
### Key Observations
1. **Correlation Between Source and Target Conductance**:
- The left heatmap shows a positive correlation between source and target conductances, with higher values in the upper-right quadrant.
- The right heatmap reveals that variability (STD) increases with higher conductances, as seen in the orange regions.
2. **Outliers**:
- The left heatmap has a single extreme value (**7.5**) in the bottom-right corner, which may indicate an anomaly or a specific experimental condition.
- The right heatmap shows a cluster of high STD values in the upper-right quadrant, suggesting inconsistent measurements at high conductances.
3. **Color Consistency**:
- The color gradients in both heatmaps align with their respective legends, confirming accurate representation of numerical values.
---
### Interpretation
The data suggests that **mean conductance values increase with higher source and target conductances**, while **standard deviation (variability) also rises** in these regions. This could imply that the system being studied (e.g., a conductance measurement setup) becomes less predictable or more variable at higher conductances. The extreme positive value in the left heatmap (7.5) may indicate a specific experimental condition or a data point requiring further investigation. The consistency of color coding across both heatmaps reinforces the reliability of the data representation. Overall, the heatmaps highlight a relationship between conductance levels and their associated statistical properties, which could be critical for optimizing measurement protocols or understanding system behavior.