\n
## Diagram: Data Co-location Attack
### Overview
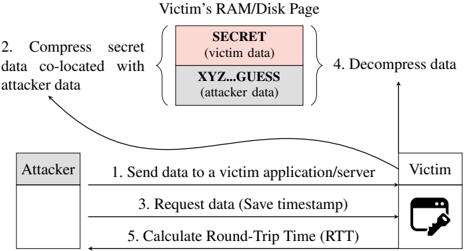
This diagram illustrates a data co-location attack, where an attacker attempts to infer information about sensitive victim data by exploiting the physical proximity of data in memory or on disk. The diagram depicts a sequence of steps involved in this attack, focusing on the interaction between an attacker and a victim application/server.
### Components/Axes
The diagram consists of three main components:
* **Attacker:** Represented by a rectangle labeled "Attacker".
* **Victim:** Represented by a rectangle labeled "Victim", with an icon of a computer and a key.
* **Victim's RAM/Disk Page:** Represented by a rectangle labeled "Victim's RAM/Disk Page", containing two blocks labeled "SECRET (victim data)" and "XYZ...GUESS (attacker data)".
The diagram also includes numbered arrows indicating the flow of information and actions:
1. "Send data to a victim application/server"
2. "Compress secret data co-located with attacker data"
3. "Request data (Save timestamp)"
4. "Decompress data"
5. "Calculate Round-Trip Time (RTT)"
### Detailed Analysis or Content Details
The diagram shows the following sequence of events:
1. The attacker sends data to a victim application/server. This is represented by a horizontal arrow from the "Attacker" to the "Victim".
2. The attacker's data ("XYZ...GUESS") and the victim's secret data ("SECRET") are co-located in the victim's RAM/Disk Page. The attacker then compresses the secret data along with its own data. This is indicated by a curved arrow from the "Victim's RAM/Disk Page" to the "Attacker".
3. The attacker requests data from the victim, saving a timestamp. This is represented by a horizontal arrow from the "Attacker" to the "Victim".
4. The victim decompresses the data. This is indicated by a curved arrow from the "Victim" to the "Victim's RAM/Disk Page".
5. The attacker calculates the Round-Trip Time (RTT). This is represented by a horizontal arrow from the "Victim" to the "Attacker".
The "Victim's RAM/Disk Page" is divided into two sections:
* A pink section labeled "SECRET (victim data)".
* A white section labeled "XYZ...GUESS (attacker data)".
### Key Observations
The diagram highlights the importance of data co-location in this attack. By strategically placing its data near sensitive victim data, the attacker can potentially infer information about the secret data through timing attacks or other side-channel techniques. The RTT calculation is a key component of the attack, as it allows the attacker to measure the time it takes to access the victim's data.
### Interpretation
This diagram illustrates a side-channel attack that exploits the physical proximity of data in memory or on disk. The attacker leverages the fact that data located close together can be accessed more quickly, allowing it to infer information about the victim's secret data. The attack relies on the attacker's ability to control the placement of its data relative to the victim's data, and to accurately measure the time it takes to access the victim's data. The RTT calculation is a crucial step in this process, as it provides the attacker with a timing signal that can be used to extract information about the secret data. This type of attack demonstrates the vulnerabilities that can arise from shared resources and the importance of implementing security measures to protect against side-channel attacks. The diagram suggests that the attacker is attempting to deduce the contents of the "SECRET" data by observing how the system responds to requests involving the "XYZ...GUESS" data. The timestamp saved during the request (step 3) is likely used in conjunction with the RTT calculation (step 5) to refine the attack.