## Diagram Type: Flowchart
### Overview
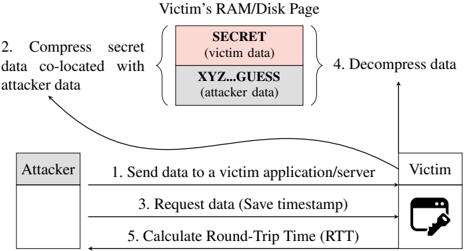
The image is a flowchart that illustrates the process of data transmission and processing between an attacker and a victim in a cybersecurity context. The flowchart is divided into five steps, each represented by a numbered box and an arrow indicating the direction of data flow.
### Components/Axes
- **Victim's RAM/Disk Page**: This is the starting point of the flowchart, where the victim's computer memory and disk are located.
- **Attacker**: This is the entity that initiates the data transmission process.
- **Victim**: This is the entity that receives the data and processes it.
- **Secret Data**: This is the data that is being transmitted and processed by the victim.
- **Attacker Data**: This is the data that is being transmitted and processed by the attacker.
- **Compress Data**: This is the step where the secret data is compressed along with the attacker data.
- **Decompress Data**: This is the step where the data is decompressed to reveal the secret data.
- **Send Data**: This is the step where the compressed data is sent to the victim's application/server.
- **Request Data**: This is the step where the victim requests the data from the attacker.
- **Calculate Round-Trip Time (RTT)**: This is the step where the RTT is calculated to measure the time taken for data transmission.
### Detailed Analysis or ### Content Details
- **Step 1**: The attacker sends data to the victim's application/server.
- **Step 2**: The attacker compresses the secret data along with the attacker data.
- **Step 3**: The victim requests the data from the attacker.
- **Step 4**: The attacker decompresses the data to reveal the secret data.
- **Step 5**: The RTT is calculated to measure the time taken for data transmission.
### Key Observations
- The flowchart shows that the attacker is able to transmit secret data to the victim's application/server.
- The attacker is also able to compress the secret data along with the attacker data, making it difficult for the victim to detect the presence of the secret data.
- The flowchart also shows that the attacker is able to calculate the RTT, which can be used to measure the time taken for data transmission.
### Interpretation
The flowchart demonstrates the process of data transmission and processing between an attacker and a victim in a cybersecurity context. The attacker is able to transmit secret data to the victim's application/server, compress it along with the attacker data, and calculate the RTT to measure the time taken for data transmission. This flowchart highlights the importance of data encryption and compression in protecting sensitive information from unauthorized access.