# Technical Data Extraction: Model Performance Comparison
## 1. Component Isolation
### Header (Legend)
Located at the top of the image, centered horizontally.
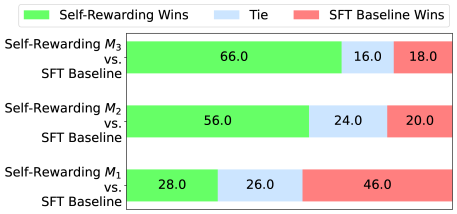
* **Green Rectangle:** "Self-Rewarding Wins"
* **Light Blue Rectangle:** "Tie"
* **Red/Salmon Rectangle:** "SFT Baseline Wins"
### Main Chart Area
A horizontal stacked bar chart comparing three iterations of a "Self-Rewarding" model ($M_1, M_2, M_3$) against an "SFT Baseline".
---
## 2. Data Table Reconstruction
The chart represents percentage-based win/loss/tie rates. Each row sums to 100.0.
| Model Comparison | Self-Rewarding Wins (Green) | Tie (Blue) | SFT Baseline Wins (Red) |
| :--- | :---: | :---: | :---: |
| **Self-Rewarding $M_3$ vs. SFT Baseline** | 66.0 | 16.0 | 18.0 |
| **Self-Rewarding $M_2$ vs. SFT Baseline** | 56.0 | 24.0 | 20.0 |
| **Self-Rewarding $M_1$ vs. SFT Baseline** | 28.0 | 26.0 | 46.0 |
---
## 3. Trend Verification and Analysis
### Y-Axis Categories (Bottom to Top)
1. **Self-Rewarding $M_1$ vs. SFT Baseline:** The baseline model outperforms the self-rewarding model in this initial iteration.
2. **Self-Rewarding $M_2$ vs. SFT Baseline:** The self-rewarding model takes the lead, showing significant improvement over $M_1$.
3. **Self-Rewarding $M_3$ vs. SFT Baseline:** The self-rewarding model achieves its highest win rate, further widening the gap against the baseline.
### Key Trends
* **Self-Rewarding Performance:** Shows a clear upward trajectory across iterations ($M_1 \rightarrow M_2 \rightarrow M_3$).
* **SFT Baseline Performance:** Relative win rate decreases as the Self-Rewarding model iterates.
* **Tie Rate:** Decreases as the Self-Rewarding model becomes more distinct in performance from the baseline.