\n
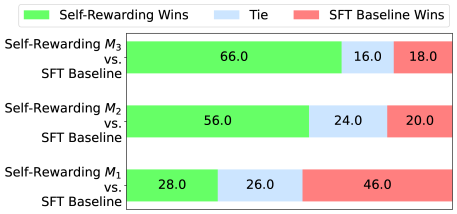
## Stacked Bar Chart: Self-Rewarding vs. SFT Baseline Wins
### Overview
This is a stacked horizontal bar chart comparing the win rates of three "Self-Rewarding" models (M1, M2, and M3) against an "SFT Baseline" model. The chart displays the percentage of wins for each category: Self-Rewarding Wins (green), Ties (blue), and SFT Baseline Wins (red).
### Components/Axes
* **Y-axis:** Lists the three model comparisons: "Self-Rewarding M3 vs. SFT Baseline", "Self-Rewarding M2 vs. SFT Baseline", and "Self-Rewarding M1 vs. SFT Baseline".
* **X-axis:** Represents the percentage of wins, ranging from 0% to 100% (though the chart only displays up to 66%). No explicit axis label is present, but it is implied.
* **Legend (Top-Left):**
* Green: "Self-Rewarding Wins"
* Blue: "Tie"
* Red: "SFT Baseline Wins"
### Detailed Analysis
The chart consists of three stacked bars, one for each model comparison. Each bar is divided into three segments representing the win percentages for each category.
* **Self-Rewarding M3 vs. SFT Baseline:**
* Self-Rewarding Wins (Green): Approximately 66.0%
* Tie (Blue): Approximately 16.0%
* SFT Baseline Wins (Red): Approximately 18.0%
* **Self-Rewarding M2 vs. SFT Baseline:**
* Self-Rewarding Wins (Green): Approximately 56.0%
* Tie (Blue): Approximately 24.0%
* SFT Baseline Wins (Red): Approximately 20.0%
* **Self-Rewarding M1 vs. SFT Baseline:**
* Self-Rewarding Wins (Green): Approximately 28.0%
* Tie (Blue): Approximately 26.0%
* SFT Baseline Wins (Red): Approximately 46.0%
### Key Observations
* Self-Rewarding M3 consistently outperforms the SFT Baseline, with the highest percentage of wins (66.0%).
* As the model number decreases (M3 to M2 to M1), the percentage of Self-Rewarding Wins decreases, and the percentage of SFT Baseline Wins increases.
* The "Tie" percentage remains relatively stable across all three model comparisons, fluctuating between 16.0% and 26.0%.
* Self-Rewarding M1 performs worse than the SFT Baseline, with only 28.0% wins compared to 46.0% for the baseline.
### Interpretation
The data suggests that the self-rewarding mechanism is most effective in model M3, and its effectiveness diminishes as the model number decreases. Model M3 demonstrates a clear advantage over the SFT Baseline, while model M1 is outperformed by the baseline. The consistent presence of ties indicates that a significant portion of the comparisons result in neither model clearly winning. This could be due to the inherent complexity of the task or limitations in the evaluation metric. The trend suggests that the self-rewarding approach needs further refinement to consistently outperform the SFT Baseline across all models. The differences in performance between the models (M1, M2, M3) could be due to variations in their architecture, training data, or hyperparameter settings. Further investigation is needed to understand the factors contributing to these performance differences.