## Horizontal Stacked Bar Chart: Self-Rewarding Model vs. SFT Baseline Performance
### Overview
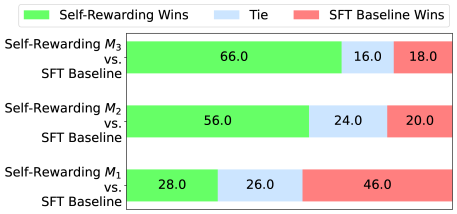
The image displays a horizontal stacked bar chart comparing the performance of three versions of a "Self-Rewarding" model (M1, M2, M3) against a common "SFT Baseline" model. The chart quantifies the outcomes of comparisons as percentages of wins for each model and ties.
### Components/Axes
* **Chart Type:** Horizontal Stacked Bar Chart.
* **Y-Axis (Vertical):** Lists the three comparison pairs. From top to bottom:
1. `Self-Rewarding M₃ vs. SFT Baseline`
2. `Self-Rewarding M₂ vs. SFT Baseline`
3. `Self-Rewarding M₁ vs. SFT Baseline`
* **X-Axis (Horizontal):** Implicitly represents percentage (0-100%), though no numerical axis labels are present. The total length of each bar represents 100% of the comparison outcomes.
* **Legend:** Positioned at the top of the chart.
* **Green Square:** `Self-Rewarding Wins`
* **Light Blue Square:** `Tie`
* **Red Square:** `SFT Baseline Wins`
* **Data Labels:** Percentage values are embedded directly within each colored segment of the bars.
### Detailed Analysis
Each bar is segmented into three colored parts corresponding to the legend. The values are transcribed as follows:
1. **Top Bar: Self-Rewarding M₃ vs. SFT Baseline**
* **Green Segment (Left):** `66.0` (Self-Rewarding Wins)
* **Light Blue Segment (Center):** `16.0` (Tie)
* **Red Segment (Right):** `18.0` (SFT Baseline Wins)
* **Trend:** The green segment is dominant, occupying nearly two-thirds of the bar, indicating a strong performance advantage for the M₃ model.
2. **Middle Bar: Self-Rewarding M₂ vs. SFT Baseline**
* **Green Segment (Left):** `56.0` (Self-Rewarding Wins)
* **Light Blue Segment (Center):** `24.0` (Tie)
* **Red Segment (Right):** `20.0` (SFT Baseline Wins)
* **Trend:** The green segment is still the largest, but smaller than in M₃. The tie segment is notably larger.
3. **Bottom Bar: Self-Rewarding M₁ vs. SFT Baseline**
* **Green Segment (Left):** `28.0` (Self-Rewarding Wins)
* **Light Blue Segment (Center):** `26.0` (Tie)
* **Red Segment (Right):** `46.0` (SFT Baseline Wins)
* **Trend:** The red segment is the largest, indicating the SFT Baseline wins more often than the M₁ model. The green segment is the smallest of all three bars.
### Key Observations
* **Clear Performance Gradient:** There is a stark, monotonic improvement in the Self-Rewarding model's performance as the version number increases from M₁ to M₃.
* **M₁ Underperformance:** The Self-Rewarding M₁ model loses to the SFT Baseline more often than it wins (46.0% vs. 28.0%).
* **M₃ Dominance:** The Self-Rewarding M₃ model achieves a decisive win rate of 66.0%, losing only 18.0% of the time.
* **Tie Rate Variation:** The percentage of ties is not constant. It is lowest for M₃ (16.0%) and highest for M₂ (24.0%).
### Interpretation
This chart demonstrates the progressive efficacy of an iterative model development process, likely involving self-rewarding or reinforcement learning techniques. The data suggests that successive versions (M₁ → M₂ → M₃) of the Self-Rewarding model have learned to significantly outperform the fixed SFT (Supervised Fine-Tuning) Baseline.
The inversion of the win/loss ratio from M₁ (where the baseline is superior) to M₃ (where the self-rewarding model is dominant) indicates a successful training or alignment trajectory. The varying tie rates may reflect changes in model confidence or the distinctness of the outputs between versions. The primary takeaway is that the "Self-Rewarding" approach, as embodied in model M₃, yields a substantially more capable model than the standard SFT baseline it was compared against.