# Technical Document Extraction: Line Graph Analysis
## 1. Axis Labels and Markers
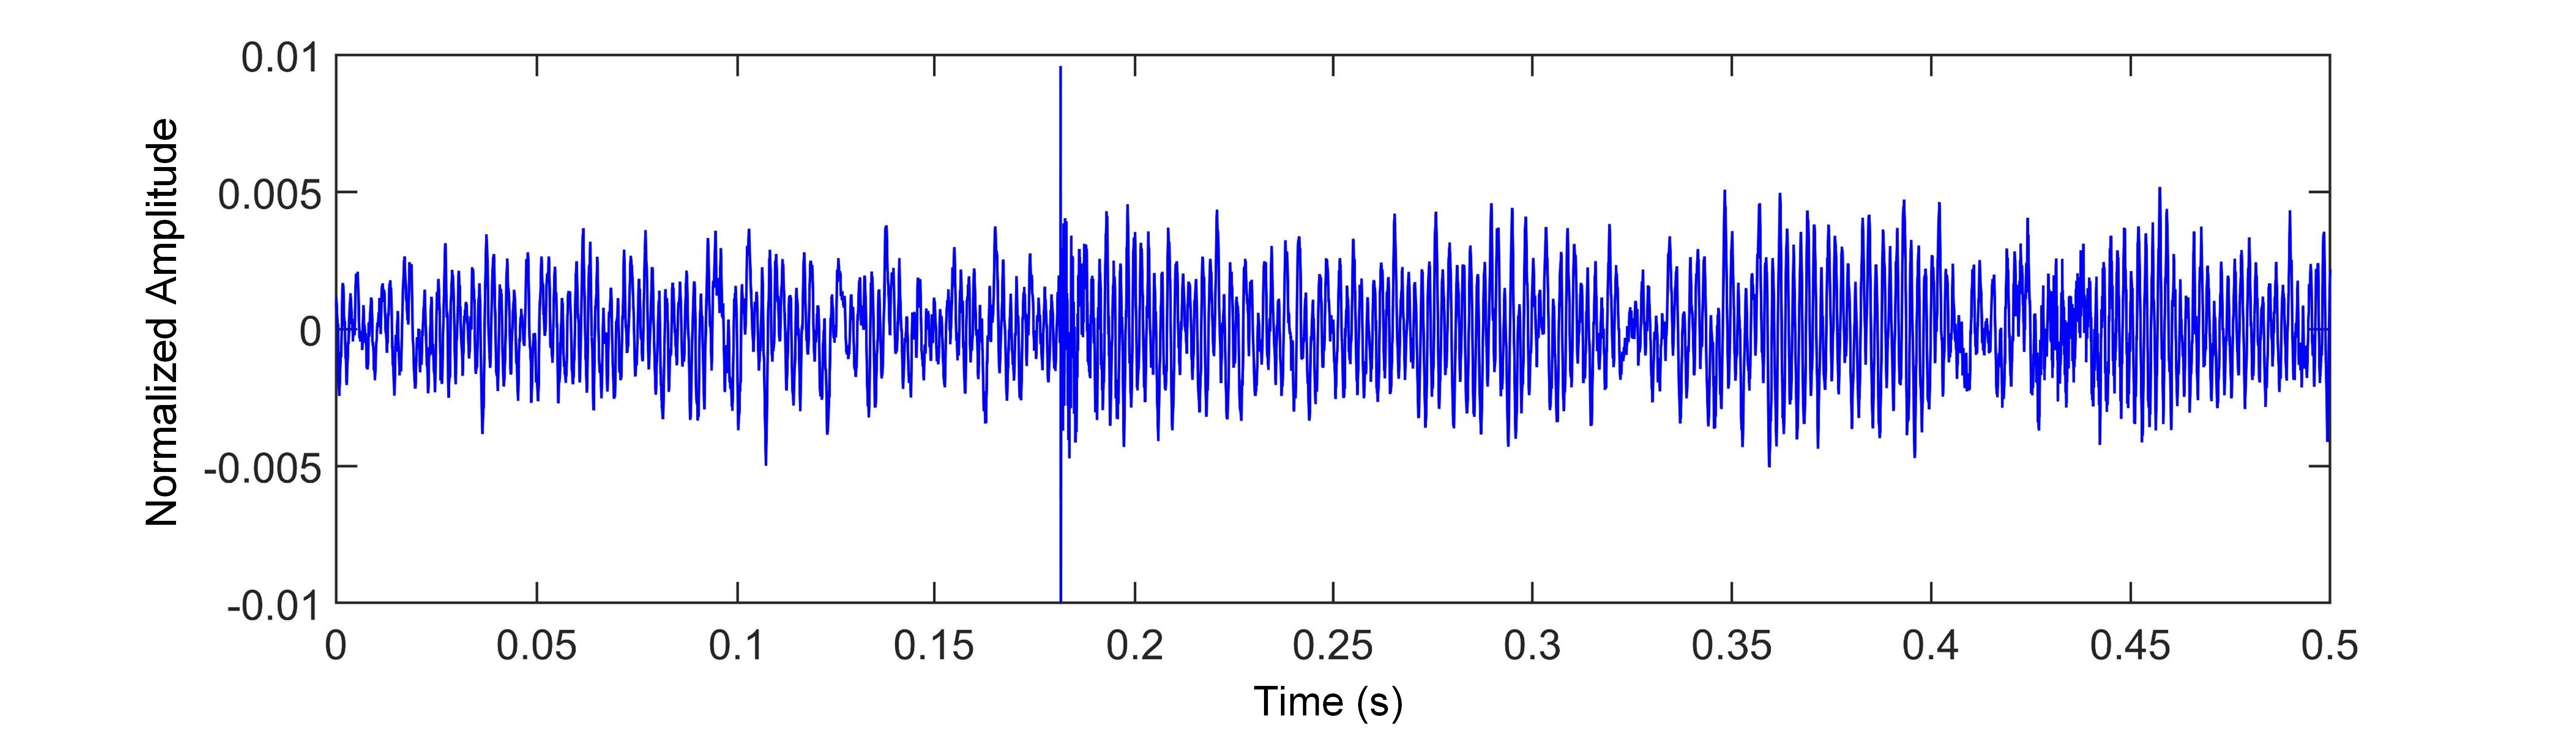
- **Y-Axis**:
- Label: `Normalized Amplitude`
- Range: `-0.01` to `0.01`
- Increment: `0.005`
- **X-Axis**:
- Label: `Time (s)`
- Range: `0` to `0.5`
- Increment: `0.05`
## 2. Key Trends and Data Points
- **Primary Line Behavior**:
- The blue line exhibits **high-frequency oscillations** between `-0.005` and `0.005` for most of the time interval.
- **Notable Spike**: At `x = 0.15 s`, the amplitude abruptly reaches the maximum value of `0.01`, followed by a sharp decline.
- Post-spike oscillations resume with reduced amplitude variability compared to the pre-spike segment.
## 3. Component Isolation
- **Main Chart**:
- Dominated by the blue oscillating line.
- No secondary data series or annotations present.
- **Axes and Title**:
- No additional text or legends outside the axis labels.
## 4. Spatial Grounding
- **Spike Location**:
- Coordinates: `[0.15 s, 0.01]` (blue line).
- Confirmed via alignment with x-axis marker `0.15` and y-axis peak at `0.01`.
## 5. Trend Verification
- **Pre-Spike (0–0.15 s)**:
- Line oscillates erratically with no discernible pattern.
- Amplitude range: `[-0.005, 0.005]`.
- **Post-Spike (0.15–0.5 s)**:
- Oscillations stabilize with smaller amplitude swings.
- Reduced variability compared to pre-spike segment.
## 6. Missing Elements
- **Legend**: Absent.
- **Additional Text**: No annotations, titles, or labels beyond axis markers.
## 7. Data Table Reconstruction
- **Not Applicable**: No embedded data tables present.
## 8. Language and Transcription
- **Language**: English (no non-English text detected).
- **Transcription**: All axis labels and markers transcribed verbatim.
## 9. Final Notes
- The graph represents a **normalized amplitude signal over time**, with a singular high-amplitude event at `0.15 s`.
- No contextual metadata (e.g., experiment conditions) is provided in the image.