## Heatmap: Model Depth vs. Tokens
### Overview
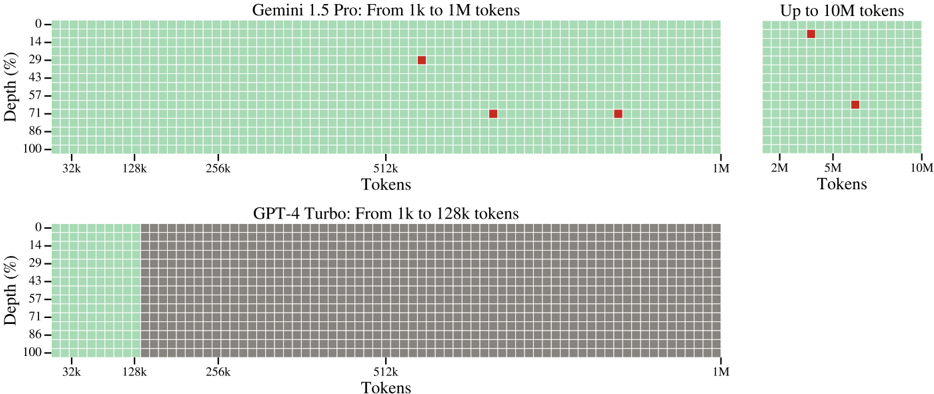
The image presents three heatmaps comparing the depth (percentage) against the number of tokens for two language models: Gemini 1.5 Pro and GPT-4 Turbo. The heatmaps use a grid structure, with the x-axis representing tokens and the y-axis representing depth. Red squares indicate specific data points within the Gemini 1.5 Pro heatmaps, while color variations (green and gray) indicate different regions in the GPT-4 Turbo heatmap.
### Components/Axes
* **Y-Axis (Depth %):** Ranges from 0% to 100% in increments of approximately 14% (0, 14, 29, 43, 57, 71, 86, 100).
* **X-Axis (Tokens):**
* **Gemini 1.5 Pro (Left):** Ranges from 32k to 1M tokens (32k, 128k, 256k, 512k, 1M). Title: "Gemini 1.5 Pro: From 1k to 1M tokens"
* **Gemini 1.5 Pro (Right):** Ranges from 1M to 10M tokens (1M, 2M, 5M, 10M). Title: "Up to 10M tokens"
* **GPT-4 Turbo:** Ranges from 32k to 1M tokens (32k, 128k, 256k, 512k, 1M). Title: "GPT-4 Turbo: From 1k to 128k tokens"
* **Colors:**
* Green: Indicates a specific state or region.
* Gray: Indicates a different state or region.
* Red: Indicates a specific data point.
### Detailed Analysis
**Gemini 1.5 Pro (From 1k to 1M tokens):**
* The heatmap is primarily green.
* A red square is located at approximately 29% depth and 512k tokens.
* A red square is located at approximately 71% depth and 512k tokens.
* A red square is located at approximately 29% depth and 1M tokens.
**Gemini 1.5 Pro (Up to 10M tokens):**
* The heatmap is primarily green.
* A red square is located at approximately 14% depth and 5M tokens.
* A red square is located at approximately 71% depth and 5M tokens.
**GPT-4 Turbo (From 1k to 128k tokens):**
* The heatmap is divided into two regions.
* The region from 32k to 128k tokens is green.
* The region from 128k to 1M tokens is gray.
### Key Observations
* Gemini 1.5 Pro has specific data points (red squares) at certain depths and token counts.
* GPT-4 Turbo exhibits a clear division based on token count, with different regions colored green and gray.
### Interpretation
The heatmaps provide a visual representation of how depth relates to token count for the two language models. The red squares in the Gemini 1.5 Pro heatmaps might indicate specific performance metrics or areas of interest. The color division in the GPT-4 Turbo heatmap suggests a change in behavior or characteristics at the 128k token mark. The data suggests that Gemini 1.5 Pro's behavior is being observed at specific token and depth levels, while GPT-4 Turbo has a distinct change in state at 128k tokens. Further context is needed to understand the exact meaning of "depth" and the significance of the red squares and color variations.