## Heatmap/Chart: Token Context Window Depth Comparison
### Overview
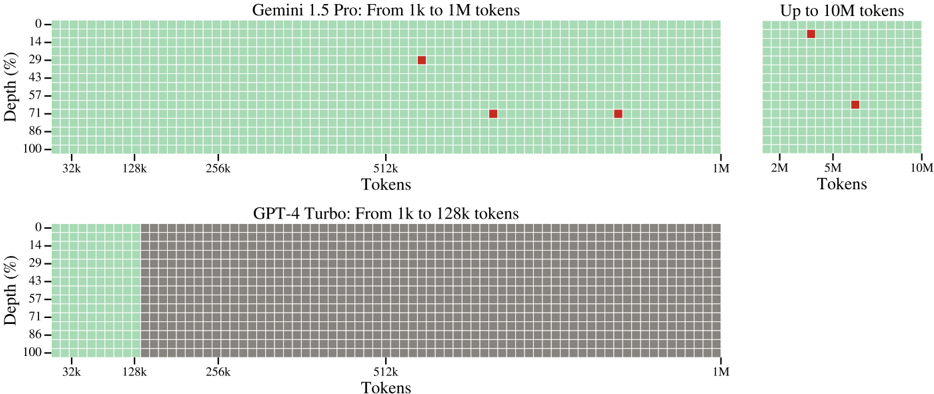
The image is a technical comparison chart visualizing the effective context window depth (as a percentage) for two large language models: **Gemini 1.5 Pro** and **GPT-4 Turbo**. It uses a grid-based heatmap where each cell represents a segment of the context window. Green cells indicate available or processed tokens, while gray cells indicate unavailable or unprocessed tokens. Red squares mark specific data points of interest, likely representing tested or optimal performance depths at various token lengths.
### Components/Axes
* **Chart Titles:**
* Top Left: "Gemini 1.5 Pro: From 1k to 1M tokens"
* Top Right: "Up to 10M tokens" (This is a continuation/extension of the Gemini 1.5 Pro chart).
* Bottom: "GPT-4 Turbo: From 1k to 128k tokens"
* **Y-Axis (Vertical):** Labeled "Depth (%)". The scale runs from 0% at the top to 100% at the bottom, with major tick marks at 0, 14, 29, 43, 57, 71, 86, and 100.
* **X-Axis (Horizontal):** Labeled "Tokens". The scale is logarithmic.
* For the main Gemini chart and the GPT-4 chart: Major tick marks are at 32k, 128k, 256k, 512k, and 1M.
* For the extended Gemini chart: Major tick marks are at 2M, 5M, and 10M.
* **Legend/Color Key (Implied):**
* **Green Grid Cells:** Represent the active, accessible, or successfully processed portion of the context window.
* **Gray Grid Cells:** Represent the inactive, inaccessible, or unprocessed portion of the context window.
* **Red Squares:** Represent specific, highlighted data points indicating a measured depth percentage at a given token count.
### Detailed Analysis
**1. Gemini 1.5 Pro (Top Section):**
* **From 1k to 1M tokens:** The entire grid from 0% to 100% depth is green, indicating full context window availability up to 1 million tokens. Three red squares mark specific data points:
* **Point 1:** Located at approximately **512k tokens** on the x-axis and **~29% depth** on the y-axis.
* **Point 2:** Located at approximately **700k tokens** (between 512k and 1M) and **~71% depth**.
* **Point 3:** Located at approximately **900k tokens** (near 1M) and **~71% depth**.
* **Up to 10M tokens:** The grid remains fully green, indicating the model's context window extends to 10 million tokens. Two red squares are present:
* **Point 4:** Located at approximately **3M tokens** (between 2M and 5M) and **~14% depth**.
* **Point 5:** Located at approximately **6M tokens** (between 5M and 10M) and **~57% depth**.
**2. GPT-4 Turbo (Bottom Section):**
* The grid is **green only from 0% to 100% depth up to the 128k token mark** on the x-axis.
* From **128k tokens to 1M tokens**, the entire grid is **gray**, indicating the model's context window does not extend beyond 128k tokens in this visualization.
* **No red squares** are present on this chart.
### Key Observations
1. **Context Window Capacity:** Gemini 1.5 Pro is shown with a context window extending to 10M tokens, while GPT-4 Turbo is limited to 128k tokens.
2. **Depth Utilization:** For Gemini 1.5 Pro, the red data points suggest that effective depth (the percentage of the context window being utilized or attended to) varies significantly with token length. It is not a constant 100%. For example, at ~3M tokens, the highlighted depth is only ~14%, while at ~700k tokens, it is ~71%.
3. **Hard Limit:** The GPT-4 Turbo chart shows a hard cutoff at 128k tokens, with no capacity visualized beyond that point (gray cells).
4. **Spatial Layout:** The Gemini 1.5 Pro data is split into two adjacent charts to accommodate the vastly different scale (1M vs. 10M tokens), while the GPT-4 Turbo chart uses a single, wider grid for its 1M token scale, highlighting the unused (gray) capacity.
### Interpretation
This chart visually argues for the superior **context window scalability** of Gemini 1.5 Pro compared to GPT-4 Turbo. The key insight is not just the maximum token count (10M vs. 128k), but the visualization of **effective depth**.
The red squares on the Gemini charts are critical. They imply that "depth" is a performance metric—perhaps the percentage of the full context that the model can effectively attend to or process for a given task. The variation in these points (from 14% to 71%) suggests that maintaining high effective depth becomes more challenging as the context grows extremely large (e.g., at 3M tokens). However, the model still functions across the entire window (all green).
In contrast, the GPT-4 Turbo chart presents a binary state: full functionality up to its limit (green) and complete inability beyond it (gray). The chart does not provide data on its effective depth within the 128k window.
Therefore, the underlying message is that Gemini 1.5 Pro offers a **massively larger raw context capacity** and provides data points suggesting **variable but functional depth utilization** across that vast window, whereas GPT-4 Turbo operates within a much smaller, fixed boundary. The chart is a technical demonstration of architectural capability, likely intended for an audience comparing model specifications for tasks requiring long-context reasoning, document analysis, or extended conversation.