\n
## Chart: Stealthiness vs. Detection Likelihood and ASR
### Overview
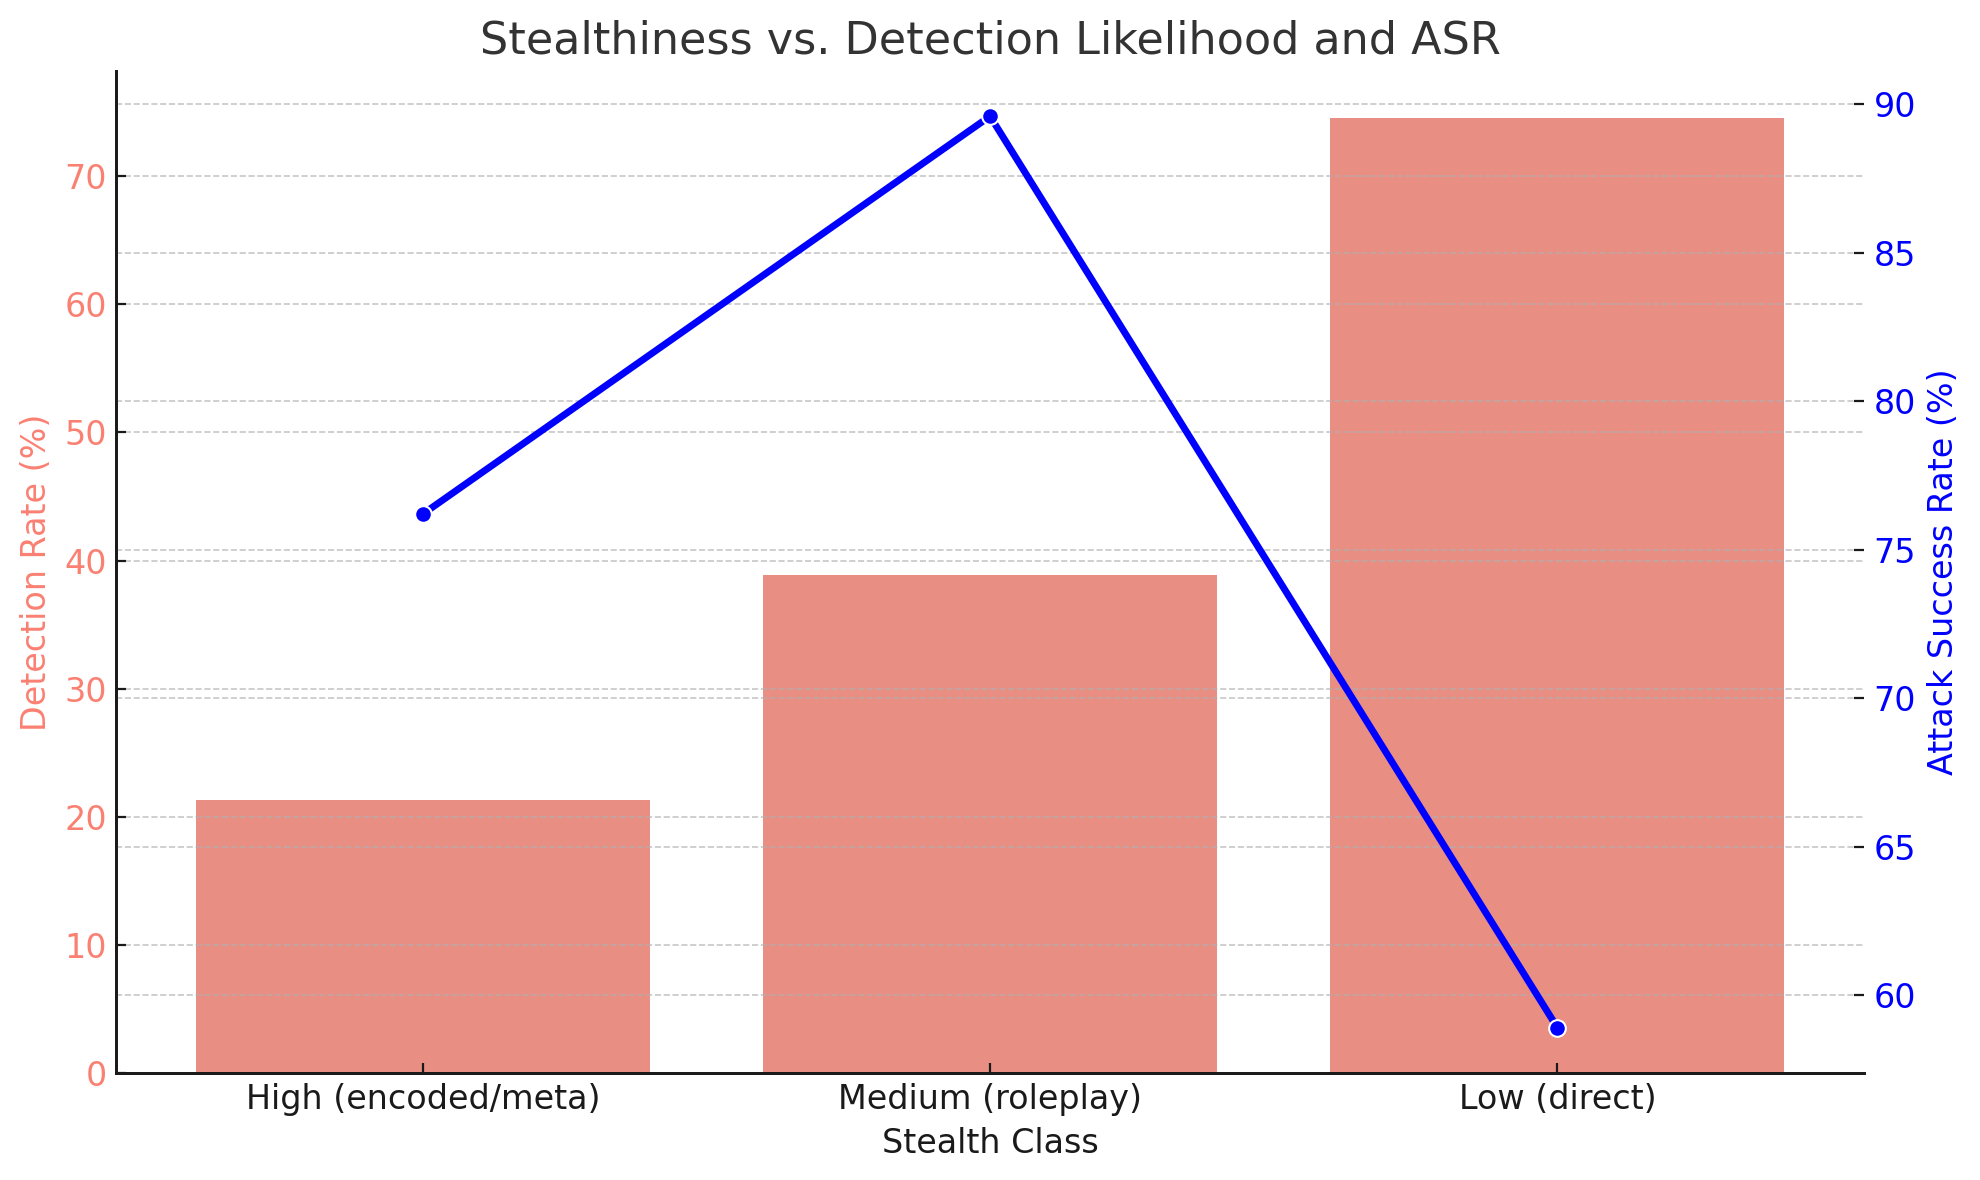
This chart visualizes the relationship between stealth class, detection rate, and attack success rate (ASR). It uses a bar chart to represent the detection rate for each stealth class, and a line graph overlaid on the bar chart to represent the ASR. The x-axis represents the stealth class, categorized as High, Medium, and Low. The primary y-axis (left) represents the detection rate in percentage, while the secondary y-axis (right) represents the attack success rate, also in percentage.
### Components/Axes
* **Title:** Stealthiness vs. Detection Likelihood and ASR
* **X-axis:** Stealth Class (High (encoded/meta), Medium (roleplay), Low (direct))
* **Primary Y-axis (left):** Detection Rate (%) - Scale from 0 to 70, increments of 10.
* **Secondary Y-axis (right):** Attack Success Rate (%) - Scale from 60 to 90, increments of 5.
* **Bar Chart:** Represents Detection Rate for each Stealth Class. Bars are colored in a shade of red.
* **Line Graph:** Represents Attack Success Rate for each Stealth Class. The line is colored blue.
* **Legend:** No explicit legend is present, but the axes labels clearly indicate what each visual element represents.
### Detailed Analysis
The chart presents three stealth classes: High, Medium, and Low.
* **High Stealth Class:**
* Detection Rate: Approximately 25%.
* Attack Success Rate: Approximately 60%.
* **Medium Stealth Class:**
* Detection Rate: Approximately 40%.
* Attack Success Rate: Approximately 73%.
* **Low Stealth Class:**
* Detection Rate: Approximately 65%.
* Attack Success Rate: Approximately 87%.
**Trend Analysis:**
* **Detection Rate:** The detection rate increases as the stealth class decreases (from High to Low). The bars show a clear upward trend.
* **Attack Success Rate:** The attack success rate also increases as the stealth class decreases (from High to Low). The blue line slopes upward.
### Key Observations
* There is a strong inverse relationship between stealthiness and detection rate. Higher stealthiness correlates with lower detection rates.
* There is a strong inverse relationship between stealthiness and attack success rate. Higher stealthiness correlates with lower attack success rates.
* The highest attack success rate is achieved with the lowest stealth class, but this comes at the cost of a significantly higher detection rate.
* The medium stealth class offers a balance between detection rate and attack success rate.
### Interpretation
The data suggests a trade-off between stealth and effectiveness. While higher stealthiness reduces the likelihood of detection, it also reduces the potential for a successful attack. Conversely, lower stealthiness increases the risk of detection but also increases the chances of a successful attack.
The chart demonstrates a clear pattern: as the complexity of stealth techniques decreases (moving from "encoded/meta" to "direct"), the detection rate increases, but so does the attack success rate. This could be due to several factors, such as the increased visibility of less sophisticated attacks or the greater ease with which they can be executed.
The "Medium (roleplay)" stealth class appears to be a sweet spot, offering a reasonable balance between detection risk and attack success. This suggests that a moderate level of stealth may be the most effective strategy in many scenarios.
The chart provides valuable insights for security professionals and attackers alike. It highlights the importance of understanding the trade-offs involved in stealth and attack strategies and tailoring them to the specific context.