## Bar Chart: Number of HE Review Papers Published Per Year (2020-2025)
### Overview
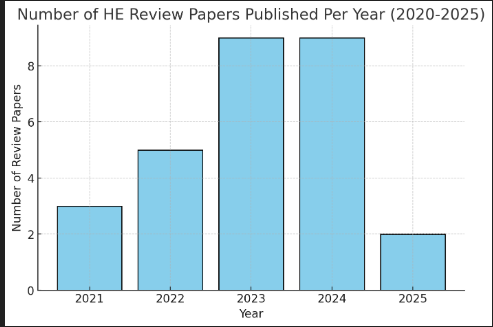
The image is a bar chart showing the number of HE (presumably Higher Education) review papers published per year from 2021 to 2025. The y-axis represents the number of review papers, and the x-axis represents the year. The bars are light blue.
### Components/Axes
* **Title:** Number of HE Review Papers Published Per Year (2020-2025)
* **X-axis:** Year, with labels for 2021, 2022, 2023, 2024, and 2025.
* **Y-axis:** Number of Review Papers, with labels at intervals of 2, from 0 to 8.
* **Data:** Light blue bars representing the number of papers published each year.
### Detailed Analysis
* **2021:** Approximately 3 papers
* **2022:** Approximately 5 papers
* **2023:** Approximately 9 papers
* **2024:** Approximately 9 papers
* **2025:** Approximately 2 papers
### Key Observations
The number of publications increases from 2021 to 2023, plateaus in 2023-2024, and then decreases significantly in 2025.
### Interpretation
The chart indicates a surge in HE review paper publications in 2023 and 2024, followed by a sharp decline in 2025. This could be due to various factors, such as changes in research funding, shifts in academic focus, or the completion of specific research projects. The initial increase suggests growing interest or emphasis on HE review papers, while the subsequent decrease warrants further investigation to understand the underlying causes. The data suggests a potential cycle or trend in HE review paper publications over the observed period.