## Bar Chart: Number of HE Review Papers Published Per Year (2020-2025)
### Overview
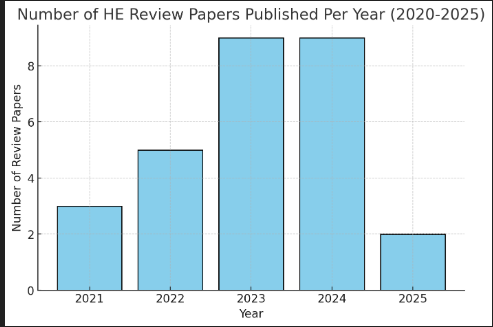
The image is a vertical bar chart displaying the annual count of "HE Review Papers" published over a five-year period. The chart shows a clear peak in publication activity in the middle years, followed by a significant decline.
### Components/Axes
* **Chart Title:** "Number of HE Review Papers Published Per Year (2020-2025)" (positioned at the top center).
* **Y-Axis (Vertical):**
* **Label:** "Number of Review Papers" (rotated 90 degrees, positioned to the left of the axis).
* **Scale:** Linear scale from 0 to 8, with major gridlines and numerical markers at intervals of 2 (0, 2, 4, 6, 8).
* **X-Axis (Horizontal):**
* **Label:** "Year" (positioned below the axis).
* **Categories:** Five discrete years: 2021, 2022, 2023, 2024, 2025.
* **Data Series:** A single series represented by light blue bars. There is no legend, as only one data category is plotted.
* **Grid:** A light gray grid is present in the background, aligned with the y-axis markers.
### Detailed Analysis
The following data points are extracted by aligning the top of each bar with the y-axis scale. Values for 2023 and 2024 are approximate as they exceed the top gridline of 8.
* **2021:** The bar height aligns with the midpoint between the 2 and 4 gridlines. **Value: 3 review papers.**
* **2022:** The bar height aligns with the midpoint between the 4 and 6 gridlines. **Value: 5 review papers.**
* **2023:** The bar extends above the top gridline (8). Visually, it appears to be approximately one unit higher. **Approximate Value: 9 review papers.**
* **2024:** The bar is identical in height to the 2023 bar. **Approximate Value: 9 review papers.**
* **2025:** The bar height aligns exactly with the gridline for 2. **Value: 2 review papers.**
**Trend Verification:** The data series shows a clear upward trend from 2021 to 2023, a plateau between 2023 and 2024, and a sharp downward trend from 2024 to 2025.
### Key Observations
1. **Peak Period:** The years 2023 and 2024 represent the peak of publication activity, with both years having the highest count (approx. 9 papers each).
2. **Significant Decline:** There is a dramatic 78% decrease (from ~9 to 2) in the number of review papers published from 2024 to 2025.
3. **Title Discrepancy:** The chart title references the period "2020-2025," but data is only provided for the years 2021 through 2025. No data is shown for 2020.
4. **Consistent Growth Phase:** The period from 2021 to 2023 shows consistent year-over-year growth (from 3 to 5 to ~9).
### Interpretation
The data suggests a focused surge in review paper publications within the "HE" field (the specific meaning of "HE" is not defined in the chart) during the 2023-2024 period. This could indicate a response to a significant development, a special issue, or a culmination of research trends that required synthesis. The sharp drop in 2025 is the most notable anomaly. Possible explanations include: a natural conclusion to the research cycle that prompted the reviews, a shift in research focus, or that the data for 2025 is incomplete (e.g., the chart was created early in the year). The absence of 2020 data, despite its mention in the title, is an important omission that limits the full context of the trend. The chart effectively communicates a story of rapid growth, peak consolidation, and a subsequent sharp contraction in this specific academic output.