## Bar Chart: Number of HE Review Papers Published Per Year (2020-2025)
### Overview
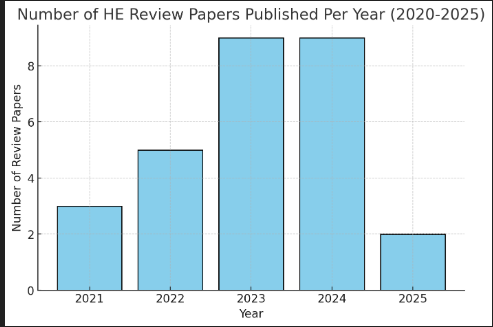
The chart displays the number of HE (Higher Education) review papers published annually from 2021 to 2025. The y-axis represents the "Number of Review Papers," while the x-axis lists the years. The data shows a fluctuating trend, with peaks in 2023 and 2024, followed by a sharp decline in 2025.
### Components/Axes
- **Title**: "Number of HE Review Papers Published Per Year (2020-2025)"
- **X-axis (Year)**: Labeled "Year," with categories for 2021, 2022, 2023, 2024, and 2025.
- **Y-axis (Number of Review Papers)**: Labeled "Number of Review Papers," with a scale from 0 to 10.
- **Bars**: All bars are blue, with no legend explicitly visible. The data series is implied by the uniform color.
- **Gridlines**: Horizontal and vertical gridlines are present for reference.
### Detailed Analysis
- **2021**: Approximately **3** review papers.
- **2022**: Approximately **5** review papers.
- **2023**: Approximately **9** review papers (peak).
- **2024**: Approximately **9** review papers (peak).
- **2025**: Approximately **2** review papers (sharp decline).
### Key Observations
- The number of review papers increased steadily from 2021 to 2023, reaching a peak of **9** in both 2023 and 2024.
- A significant drop occurred in 2025, with only **2** review papers published, a **77% decrease** from the previous year.
- The data suggests a potential cyclical pattern or external factors influencing publication trends.
### Interpretation
The chart indicates a surge in HE review paper publications between 2021 and 2024, possibly reflecting increased academic activity, funding, or institutional priorities. The abrupt decline in 2025 raises questions about sustainability, potential policy changes, or shifts in research focus. The lack of a legend or additional context limits the ability to attribute the trends to specific causes. The data highlights the importance of monitoring publication trends to understand academic or institutional dynamics.