\n
## Line Chart: ΔP vs. Layer for Qwen Models
### Overview
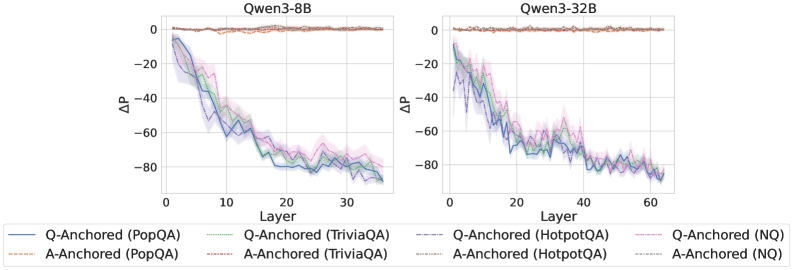
The image presents two line charts comparing the change in performance (ΔP) across layers for two Qwen language models: Qwen3-8B and Qwen3-32B. Each chart displays multiple lines representing different question-answering datasets (PopQA, TriviaQA, HotpotQA, and NQ) and anchoring methods (Q-Anchored and A-Anchored). The charts aim to visualize how performance changes as the model depth (layer) increases.
### Components/Axes
* **X-axis:** Layer (ranging from 0 to approximately 35 for Qwen3-8B and 0 to 60 for Qwen3-32B).
* **Y-axis:** ΔP (ranging from approximately -90 to 0).
* **Models:** Qwen3-8B (left chart), Qwen3-32B (right chart).
* **Datasets/Anchoring:**
* PopQA (Q-Anchored - Blue, A-Anchored - Orange)
* TriviaQA (Q-Anchored - Teal, A-Anchored - Pink)
* HotpotQA (Q-Anchored - Purple, A-Anchored - Brown)
* NQ (Q-Anchored - Light Blue, A-Anchored - Red)
* **Legend:** Located at the bottom of the image, clearly associating colors with datasets and anchoring methods.
### Detailed Analysis or Content Details
**Qwen3-8B (Left Chart):**
* **Q-Anchored (PopQA) - Blue:** Starts at approximately ΔP = -10 at Layer 0, rapidly decreases to approximately ΔP = -80 at Layer 10, and then fluctuates between -70 and -85 until Layer 35, ending at approximately ΔP = -82.
* **A-Anchored (PopQA) - Orange:** Starts at approximately ΔP = -5 at Layer 0, decreases to approximately ΔP = -70 at Layer 10, and then fluctuates between -65 and -80 until Layer 35, ending at approximately ΔP = -75.
* **Q-Anchored (TriviaQA) - Teal:** Starts at approximately ΔP = -15 at Layer 0, decreases to approximately ΔP = -75 at Layer 10, and then fluctuates between -70 and -85 until Layer 35, ending at approximately ΔP = -80.
* **A-Anchored (TriviaQA) - Pink:** Starts at approximately ΔP = -10 at Layer 0, decreases to approximately ΔP = -65 at Layer 10, and then fluctuates between -60 and -80 until Layer 35, ending at approximately ΔP = -75.
* **Q-Anchored (HotpotQA) - Purple:** Starts at approximately ΔP = -5 at Layer 0, decreases to approximately ΔP = -60 at Layer 10, and then fluctuates between -55 and -75 until Layer 35, ending at approximately ΔP = -70.
* **A-Anchored (HotpotQA) - Brown:** Starts at approximately ΔP = 0 at Layer 0, decreases to approximately ΔP = -50 at Layer 10, and then fluctuates between -45 and -65 until Layer 35, ending at approximately ΔP = -60.
* **Q-Anchored (NQ) - Light Blue:** Starts at approximately ΔP = -10 at Layer 0, decreases to approximately ΔP = -70 at Layer 10, and then fluctuates between -65 and -80 until Layer 35, ending at approximately ΔP = -78.
* **A-Anchored (NQ) - Red:** Starts at approximately ΔP = 0 at Layer 0, decreases to approximately ΔP = -50 at Layer 10, and then fluctuates between -45 and -65 until Layer 35, ending at approximately ΔP = -62.
**Qwen3-32B (Right Chart):**
* **Q-Anchored (PopQA) - Blue:** Starts at approximately ΔP = -10 at Layer 0, rapidly decreases to approximately ΔP = -80 at Layer 10, and then fluctuates between -75 and -85 until Layer 60, ending at approximately ΔP = -80.
* **A-Anchored (PopQA) - Orange:** Starts at approximately ΔP = -5 at Layer 0, decreases to approximately ΔP = -70 at Layer 10, and then fluctuates between -65 and -80 until Layer 60, ending at approximately ΔP = -75.
* **Q-Anchored (TriviaQA) - Teal:** Starts at approximately ΔP = -15 at Layer 0, decreases to approximately ΔP = -75 at Layer 10, and then fluctuates between -70 and -85 until Layer 60, ending at approximately ΔP = -80.
* **A-Anchored (TriviaQA) - Pink:** Starts at approximately ΔP = -10 at Layer 0, decreases to approximately ΔP = -65 at Layer 10, and then fluctuates between -60 and -80 until Layer 60, ending at approximately ΔP = -75.
* **Q-Anchored (HotpotQA) - Purple:** Starts at approximately ΔP = -5 at Layer 0, decreases to approximately ΔP = -60 at Layer 10, and then fluctuates between -55 and -75 until Layer 60, ending at approximately ΔP = -70.
* **A-Anchored (HotpotQA) - Brown:** Starts at approximately ΔP = 0 at Layer 0, decreases to approximately ΔP = -50 at Layer 10, and then fluctuates between -45 and -65 until Layer 60, ending at approximately ΔP = -60.
* **Q-Anchored (NQ) - Light Blue:** Starts at approximately ΔP = -10 at Layer 0, decreases to approximately ΔP = -70 at Layer 10, and then fluctuates between -65 and -80 until Layer 60, ending at approximately ΔP = -78.
* **A-Anchored (NQ) - Red:** Starts at approximately ΔP = 0 at Layer 0, decreases to approximately ΔP = -50 at Layer 10, and then fluctuates between -45 and -65 until Layer 60, ending at approximately ΔP = -62.
### Key Observations
* All lines exhibit a downward trend, indicating a decrease in performance (ΔP) as the layer number increases.
* The rate of decrease is steepest in the initial layers (0-10) for both models.
* The Q-Anchored lines generally show a slightly larger decrease in ΔP compared to the A-Anchored lines for each dataset.
* The HotpotQA dataset consistently shows the least negative ΔP values (i.e., the smallest performance decrease) across both models and anchoring methods.
* The Qwen3-32B model shows a similar trend to Qwen3-8B, but extends to a greater number of layers.
### Interpretation
The charts demonstrate that performance on question-answering tasks tends to degrade as the depth of the Qwen models increases. This could be due to issues like vanishing gradients, overfitting, or the model learning irrelevant features in deeper layers. The difference between Q-Anchored and A-Anchored lines suggests that the anchoring method influences how performance changes with depth. The consistently better performance of HotpotQA might indicate that this dataset is less sensitive to the issues affecting deeper layers, or that the models are better at capturing the reasoning patterns required for this dataset. The fact that the performance decrease plateaus after a certain number of layers suggests that there might be a limit to the benefits of increasing model depth for these specific tasks and datasets. The similar trends observed in both Qwen3-8B and Qwen3-32B suggest that the underlying phenomenon is not simply a result of model size.