## Line Graphs: ΔP Trends Across Layers in Qwen3-8B and Qwen3-32B Models
### Overview
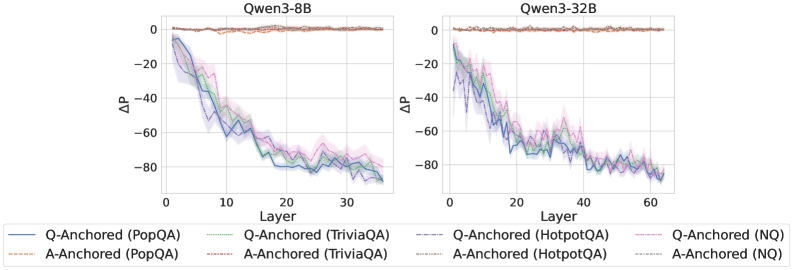
The image contains two side-by-side line graphs comparing the performance of Q-Anchored and A-Anchored methods across different layers in Qwen3-8B and Qwen3-32B models. The y-axis represents ΔP (change in performance), and the x-axis represents Layer numbers. Each graph includes multiple data series with distinct line styles and colors, representing different anchoring methods and datasets.
### Components/Axes
- **Y-Axis**: ΔP (Performance Change), ranging from -80 to 0 in both graphs.
- **X-Axis**: Layer, with Qwen3-8B spanning 0–30 layers and Qwen3-32B spanning 0–60 layers.
- **Legends**:
- **Qwen3-8B**:
- Solid blue: Q-Anchored (PopQA)
- Dashed orange: A-Anchored (PopQA)
- Solid green: Q-Anchored (TriviaQA)
- Dashed red: A-Anchored (TriviaQA)
- Solid purple: Q-Anchored (HotpotQA)
- Dashed pink: Q-Anchored (NQ)
- **Qwen3-32B**:
- Solid blue: Q-Anchored (PopQA)
- Dashed orange: A-Anchored (PopQA)
- Solid green: Q-Anchored (TriviaQA)
- Dashed red: A-Anchored (TriviaQA)
- Solid purple: Q-Anchored (HotpotQA)
- Dashed pink: Q-Anchored (NQ)
- **Shaded Areas**: Confidence intervals (e.g., ±5% of ΔP values).
### Detailed Analysis
#### Qwen3-8B Graph
- **Q-Anchored (PopQA)**: Starts near 0, drops sharply to ~-80 by Layer 30 (blue solid line).
- **A-Anchored (PopQA)**: Remains near 0 throughout (orange dashed line).
- **Q-Anchored (TriviaQA)**: Starts at ~-20, declines to ~-70 by Layer 30 (green solid line).
- **A-Anchored (TriviaQA)**: Stays near 0 (red dashed line).
- **Q-Anchored (HotpotQA)**: Begins at ~-10, decreases to ~-75 by Layer 30 (purple solid line).
- **Q-Anchored (NQ)**: Starts at ~-15, declines to ~-70 by Layer 30 (pink dashed line).
#### Qwen3-32B Graph
- **Q-Anchored (PopQA)**: Starts near 0, drops to ~-80 by Layer 60 (blue solid line).
- **A-Anchored (PopQA)**: Remains near 0 (orange dashed line).
- **Q-Anchored (TriviaQA)**: Starts at ~-20, declines to ~-75 by Layer 60 (green solid line).
- **A-Anchored (TriviaQA)**: Stays near 0 (red dashed line).
- **Q-Anchored (HotpotQA)**: Begins at ~-10, decreases to ~-80 by Layer 60 (purple solid line).
- **Q-Anchored (NQ)**: Starts at ~-15, declines to ~-85 by Layer 60 (pink dashed line).
### Key Observations
1. **Q-Anchored Methods**: All Q-Anchored lines show a consistent downward trend in ΔP across layers, with steeper declines in larger models (Qwen3-32B).
2. **A-Anchored Methods**: All A-Anchored lines remain stable near 0, indicating minimal performance change.
3. **Confidence Intervals**: Shaded regions are wider for Q-Anchored methods, suggesting higher variability in performance measurements.
4. **Dataset-Specific Trends**:
- PopQA and TriviaQA show the most significant ΔP drops.
- NQ exhibits the least severe decline among Q-Anchored methods.
### Interpretation
The data suggests that **Q-Anchored methods** are more sensitive to layer depth, with performance degradation (ΔP) increasing as layers progress. This trend is amplified in larger models (Qwen3-32B), where ΔP values reach -80–-85. In contrast, **A-Anchored methods** maintain stable performance (ΔP ≈ 0), implying robustness to layer variations. The widening confidence intervals for Q-Anchored methods highlight greater uncertainty in their measurements, potentially due to model complexity or dataset-specific challenges. The dataset-specific trends (e.g., PopQA/TriviaQA vs. NQ) indicate that certain tasks may exacerbate performance drops in Q-Anchored approaches. These findings underscore the importance of anchoring strategy selection based on model size and task requirements.