## Radar Chart: AI Model Performance Across Scientific and Technical Domains
### Overview
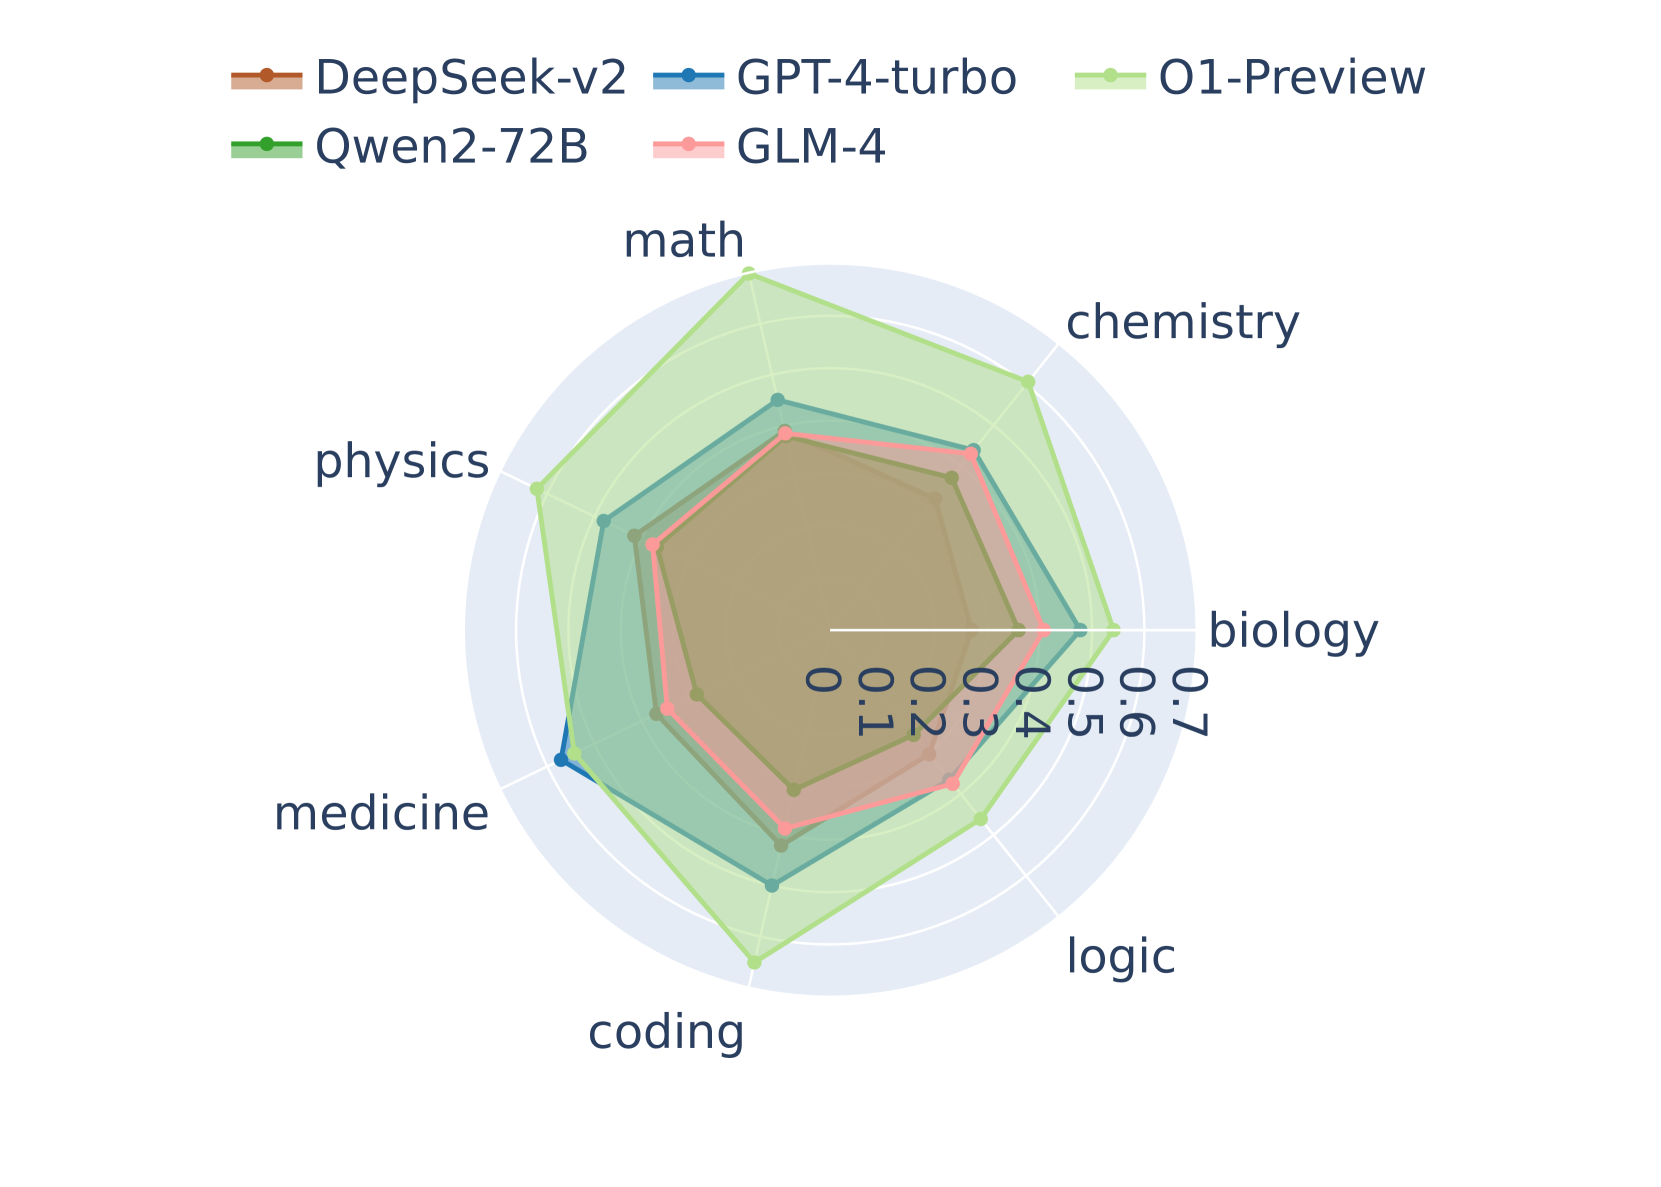
This image is a radar chart (also known as a spider chart) comparing the performance of five different Large Language Models (LLMs) across seven distinct academic and technical subject areas. The chart uses concentric heptagonal grid lines to represent a numerical scoring scale, with the models' scores plotted as colored polygons. All text in the image is in English.
### Components/Axes
**1. Header Region (Legend)**
Located at the top center of the image, the legend identifies the five data series (AI models) by color and line style. All lines feature circular markers at the data points.
* **DeepSeek-v2:** Brown/Orange line
* **GPT-4-turbo:** Blue line
* **O1-Preview:** Light Green line
* **Qwen2-72B:** Dark Green line
* **GLM-4:** Pink/Light Red line
**2. Main Chart Region (Axes and Scale)**
* **Categories (Axes):** Seven axes radiate from the center, dividing the chart into equal segments. Reading clockwise from the top (12 o'clock position), the categories are:
* `math` (Top)
* `chemistry` (Top-Right)
* `biology` (Right)
* `logic` (Bottom-Right)
* `coding` (Bottom)
* `medicine` (Bottom-Left)
* `physics` (Top-Left)
* **Scale:** The numerical scale is explicitly printed along the horizontal axis pointing towards `biology`. It starts at the center and moves outward.
* Markers: `0`, `0.1`, `0.2`, `0.3`, `0.4`, `0.5`, `0.6`, `0.7`.
* The grid consists of seven concentric white heptagons set against a light blue circular background. Each heptagon corresponds to an increment of 0.1.
### Detailed Analysis
**Trend Verification & Visual Hierarchy:**
Visually, the polygons form a distinct nested hierarchy.
* The **Light Green polygon (O1-Preview)** is the outermost shape, encompassing almost all other lines, indicating the highest overall performance. It spikes significantly outward on the `math` and `coding` axes.
* The **Blue polygon (GPT-4-turbo)** is generally the second-largest shape, sitting just inside O1-Preview, except on the `medicine` axis where it slightly overtakes O1-Preview.
* The **Pink polygon (GLM-4)** forms the third layer, closely tracking just inside GPT-4-turbo.
* The **Dark Green polygon (Qwen2-72B)** forms the fourth layer.
* The **Brown polygon (DeepSeek-v2)** is the innermost shape, indicating the lowest relative scores among the group across all categories.
**Estimated Data Points:**
*Note: Values are approximate (±0.02) based on visual interpolation between the 0.1 grid lines.*
| Category | O1-Preview (Light Green) | GPT-4-turbo (Blue) | GLM-4 (Pink) | Qwen2-72B (Dark Green) | DeepSeek-v2 (Brown) |
| :--- | :--- | :--- | :--- | :--- | :--- |
| **math** | ~0.70 | ~0.50 | ~0.48 | ~0.40 | ~0.38 |
| **chemistry** | ~0.60 | ~0.48 | ~0.50 | ~0.40 | ~0.38 |
| **biology** | ~0.60 | ~0.50 | ~0.48 | ~0.40 | ~0.38 |
| **logic** | ~0.50 | ~0.38 | ~0.40 | ~0.38 | ~0.30 |
| **coding** | ~0.70 | ~0.50 | ~0.48 | ~0.40 | ~0.38 |
| **medicine** | ~0.58 | ~0.60 | ~0.50 | ~0.40 | ~0.38 |
| **physics** | ~0.60 | ~0.50 | ~0.48 | ~0.40 | ~0.38 |
### Key Observations
1. **O1-Preview's Dominance:** O1-Preview shows exceptional performance peaks in `math` and `coding`, reaching the maximum chart value of 0.7. It leads in 6 out of 7 categories.
2. **The Medicine Anomaly:** `medicine` is the only category where O1-Preview does not hold the top score. GPT-4-turbo peaks at ~0.60 here, slightly edging out O1-Preview (~0.58).
3. **Logic as a Weak Point:** All models show a relative dip in performance on the `logic` axis compared to their scores in other scientific domains. Even the leading model (O1-Preview) drops to ~0.50 here.
4. **Tight Clustering of Inner Models:** DeepSeek-v2 and Qwen2-72B exhibit very similar performance profiles, forming a tight inner cluster. Their shapes are nearly identical, with Qwen2-72B maintaining a consistent, slight lead over DeepSeek-v2 across all axes.
### Interpretation
This radar chart illustrates a comparative benchmark of advanced AI models on complex, reasoning-heavy STEM (Science, Technology, Engineering, and Mathematics) and logic tasks.
The data suggests a clear stratification in model capabilities. **O1-Preview** represents a significant leap in quantitative and algorithmic reasoning, evidenced by its massive advantage in math and coding. This aligns with the industry understanding of "O1" class models being specifically optimized for chain-of-thought reasoning and mathematical problem-solving.
**GPT-4-turbo** remains a highly capable generalist, holding a strong second place and demonstrating superior domain-specific knowledge in medicine.
The models **GLM-4**, **Qwen2-72B**, and **DeepSeek-v2** (which are notably prominent models originating from Chinese AI labs) show respectable, balanced performance but lag behind the top-tier proprietary models (O1 and GPT-4) in these specific, rigorous benchmarks. Their highly uniform, concentric shapes suggest they share similar architectural limitations or were trained on similar distributions of scientific data, resulting in a proportional scaling of capabilities rather than domain-specific spikes.