## Radar Chart: AI Model Performance Across Academic Subjects
### Overview
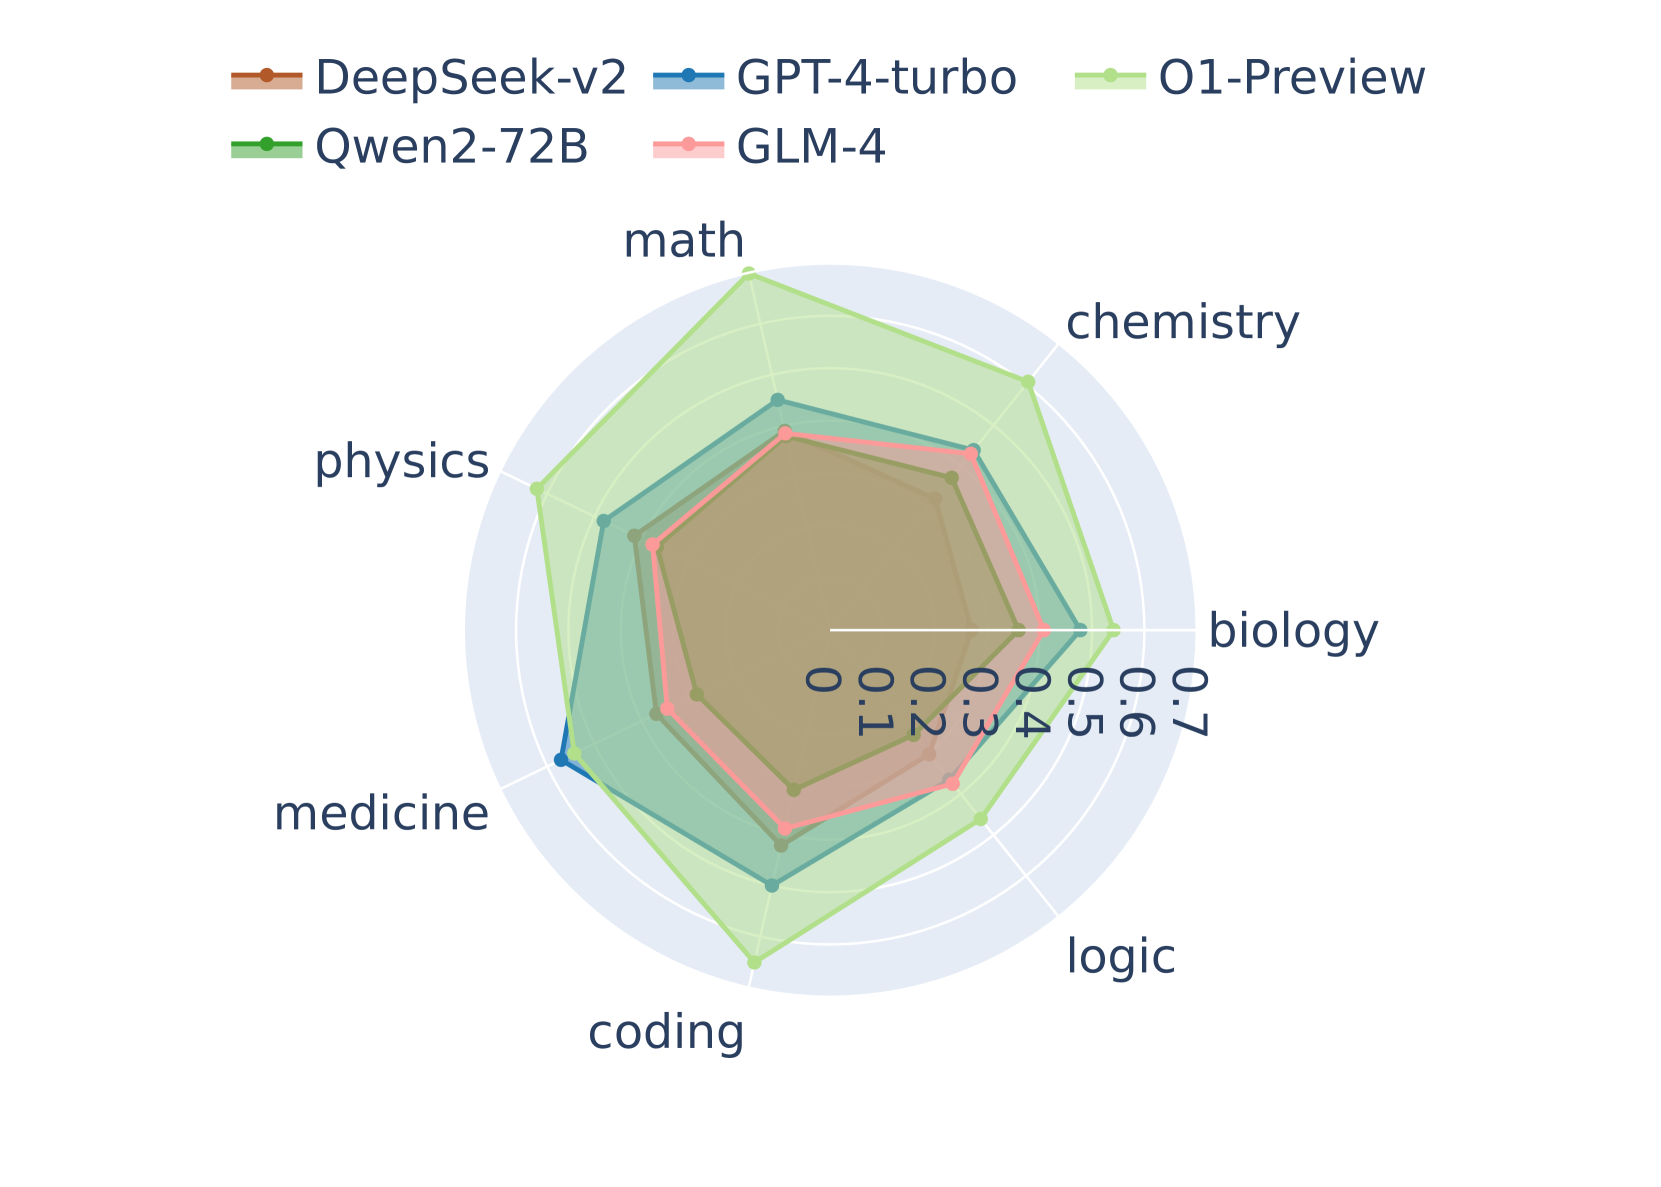
The image displays a radar chart (also known as a spider chart) comparing the performance of five different large language models (LLMs) across seven academic subject domains. The chart uses a radial layout where each axis represents a subject, and the distance from the center indicates a performance score, likely normalized between 0.0 and 0.7.
### Components/Axes
* **Chart Type:** Radar Chart.
* **Legend:** Positioned at the top-left of the chart. It contains five entries, each with a colored line and marker symbol:
* **DeepSeek-v2:** Brown line with a circular marker.
* **GPT-4-turbo:** Blue line with a circular marker.
* **O1-Preview:** Light green line with a circular marker.
* **Qwen2-72B:** Green line with a circular marker.
* **GLM-4:** Pink line with a circular marker.
* **Axes (Subjects):** Seven axes radiate from the center, labeled clockwise from the top:
1. math
2. chemistry
3. biology
4. logic
5. coding
6. medicine
7. physics
* **Scale:** Concentric circles represent the scoring scale. The innermost circle is labeled `0.0`. Moving outward, the circles are labeled `0.1`, `0.2`, `0.3`, `0.4`, `0.5`, `0.6`, and the outermost visible circle is `0.7`. The labels are rotated and placed along the "biology" axis.
### Detailed Analysis
Performance scores are approximate, estimated by the radial distance of each model's data point from the center along each subject axis.
**1. O1-Preview (Light Green):**
* **Trend:** This model forms the outermost polygon, indicating the highest overall performance. It shows a pronounced peak in `math` and strong performance in `physics` and `chemistry`.
* **Approximate Scores:**
* math: ~0.68
* chemistry: ~0.62
* biology: ~0.55
* logic: ~0.58
* coding: ~0.60
* medicine: ~0.52
* physics: ~0.65
**2. GPT-4-turbo (Blue):**
* **Trend:** Generally the second-highest performer, forming a polygon just inside O1-Preview. It shows relatively balanced performance, with a slight dip in `medicine`.
* **Approximate Scores:**
* math: ~0.58
* chemistry: ~0.55
* biology: ~0.52
* logic: ~0.53
* coding: ~0.57
* medicine: ~0.48
* physics: ~0.56
**3. Qwen2-72B (Green):**
* **Trend:** Performance is clustered in the middle range, often overlapping with or slightly inside GPT-4-turbo. It appears strongest in `coding` and `logic`.
* **Approximate Scores:**
* math: ~0.52
* chemistry: ~0.50
* biology: ~0.48
* logic: ~0.51
* coding: ~0.54
* medicine: ~0.47
* physics: ~0.50
**4. DeepSeek-v2 (Brown):**
* **Trend:** Forms a polygon similar in size to Qwen2-72B but with a different shape. It shows a notable relative strength in `medicine` compared to its other scores.
* **Approximate Scores:**
* math: ~0.50
* chemistry: ~0.48
* biology: ~0.47
* logic: ~0.49
* coding: ~0.51
* medicine: ~0.52
* physics: ~0.49
**5. GLM-4 (Pink):**
* **Trend:** This model forms the innermost polygon, indicating the lowest overall performance across all subjects in this comparison. Its scores are the most tightly clustered.
* **Approximate Scores:**
* math: ~0.45
* chemistry: ~0.44
* biology: ~0.43
* logic: ~0.44
* coding: ~0.46
* medicine: ~0.42
* physics: ~0.44
### Key Observations
1. **Clear Performance Hierarchy:** There is a distinct layering of models, with O1-Preview consistently outermost, followed by GPT-4-turbo, then Qwen2-72B and DeepSeek-v2 in a middle tier, and GLM-4 innermost.
2. **Subject-Specific Strengths:** O1-Preview shows a significant advantage in `math` and `physics`. DeepSeek-v2's performance in `medicine` is an outlier relative to its own profile, nearly matching GPT-4-turbo in that specific domain.
3. **Tight Clustering in Medicine:** The spread between the highest and lowest scores appears smallest on the `medicine` axis, suggesting more comparable performance among these models in that field.
4. **Balanced vs. Specialized Profiles:** GPT-4-turbo and GLM-4 show relatively balanced polygons. O1-Preview and DeepSeek-v2 show more pronounced peaks, indicating potential specialization.
### Interpretation
This radar chart provides a comparative snapshot of LLM capabilities across STEM and medical domains. The data suggests that **O1-Preview is the leading model in this evaluation**, demonstrating superior performance, particularly in quantitative and physical sciences. **GPT-4-turbo maintains a strong, consistent second-place position.**
The middle-tier competition between **Qwen2-72B** and **DeepSeek-v2** is nuanced; while Qwen2-72B may have a slight edge in logic and coding, DeepSeek-v2 appears more capable in medicine. This could indicate different training data emphases or architectural strengths.
**GLM-4**, while scoring lower across the board, shows a very consistent performance profile, which might indicate a different optimization strategy focused on breadth rather than peak performance in specific areas.
The chart effectively communicates that model selection should be task-dependent. For a math or physics-intensive application, O1-Preview is the clear choice. For medical applications, the gap between models narrows, and factors like efficiency or cost might become more decisive. The visualization underscores that no single model dominates every category by an equal margin, highlighting the importance of benchmarking for specific use cases.