# Technical Data Extraction: Performance Comparison of GPT2-M Models
This document provides a detailed extraction of data from two side-by-side bar charts comparing the performance of "Base" vs. "Plugin" configurations across different fine-tuning stages of the GPT2-M model.
## 1. Document Structure and Metadata
* **Image Type:** Grouped Bar Charts (2 panels).
* **Primary Language:** English.
* **X-Axis Categories (Common to both):**
1. GPT2-M (zeroshot)
2. GPT2-M (1FT)
3. GPT2-M (2FT)
4. GPT2-M (5FT)
* **Legend (Common to both):**
* **Base:** Light mauve/pink color (Left bar in each pair).
* **Plugin:** Dark purple/plum color (Right bar in each pair).
* **Legend Location:** Top-left quadrant of each chart.
* **Y-Axis Label:** "Value" (Shared/Centralized).
---
## 2. Chart 1: BLEU Score Analysis
### Component Isolation: BLEU Chart
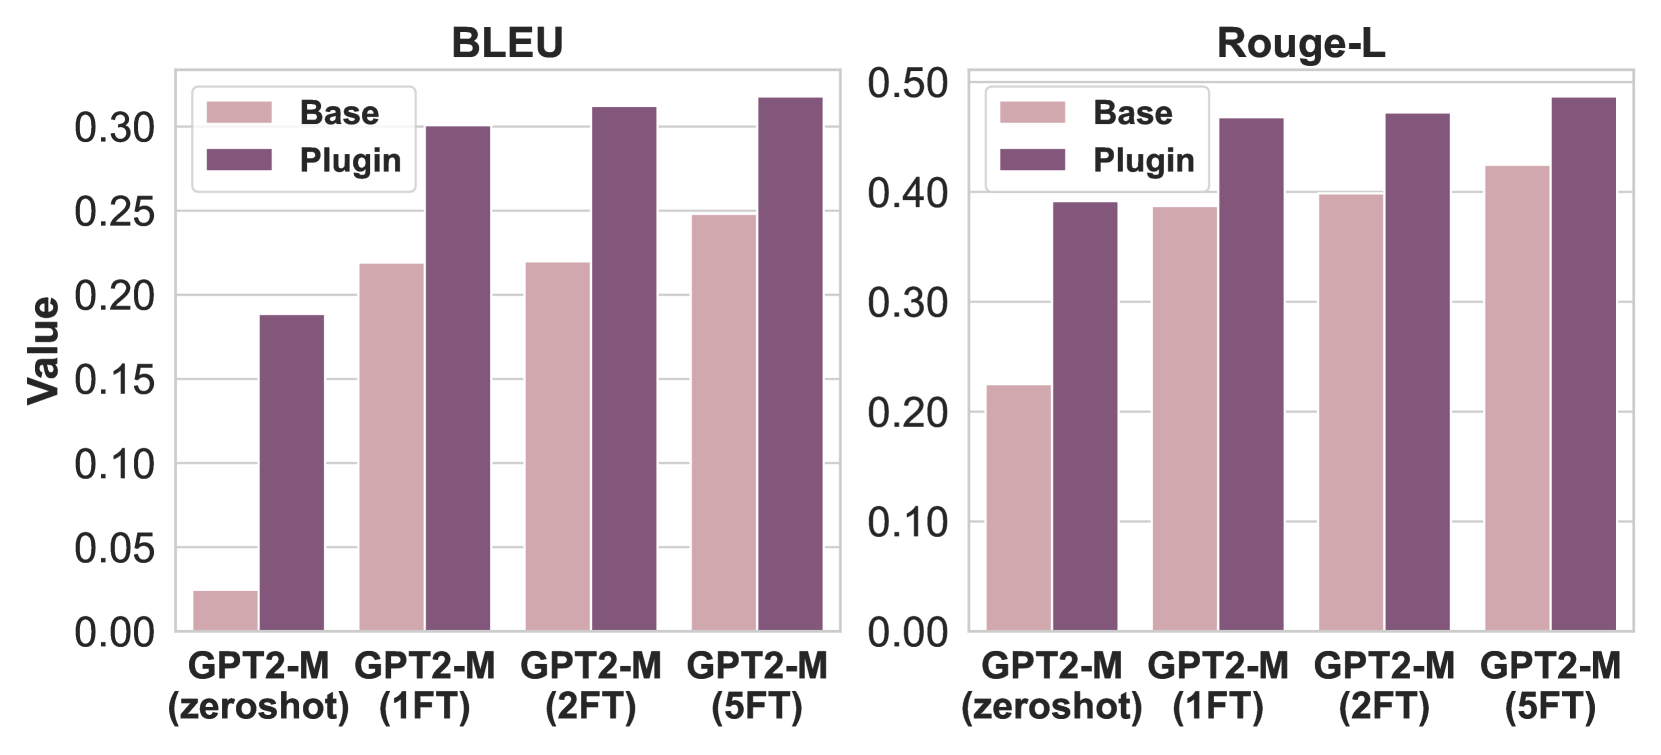
* **Header:** BLEU
* **Y-Axis Range:** 0.00 to 0.30+ (Markers every 0.05).
* **Trend Verification:**
* **Base Series:** Shows a significant jump from zeroshot to 1FT, plateaus at 2FT, and increases slightly at 5FT.
* **Plugin Series:** Shows a consistent upward trend across all stages, significantly outperforming the Base model at every stage.
### Extracted Data Points (Approximate based on grid alignment)
| Model Stage | Base (Light Mauve) | Plugin (Dark Purple) |
| :--- | :--- | :--- |
| **GPT2-M (zeroshot)** | ~0.025 | ~0.185 |
| **GPT2-M (1FT)** | ~0.220 | ~0.300 |
| **GPT2-M (2FT)** | ~0.220 | ~0.310 |
| **GPT2-M (5FT)** | ~0.245 | ~0.320 |
---
## 3. Chart 2: Rouge-L Score Analysis
### Component Isolation: Rouge-L Chart
* **Header:** Rouge-L
* **Y-Axis Range:** 0.00 to 0.50 (Markers every 0.10).
* **Trend Verification:**
* **Base Series:** Shows a steady, linear-style upward trend from zeroshot through 5FT.
* **Plugin Series:** Shows a sharp increase from zeroshot to 1FT, followed by a very gradual upward slope through 5FT.
### Extracted Data Points (Approximate based on grid alignment)
| Model Stage | Base (Light Mauve) | Plugin (Dark Purple) |
| :--- | :--- | :--- |
| **GPT2-M (zeroshot)** | ~0.225 | ~0.390 |
| **GPT2-M (1FT)** | ~0.385 | ~0.465 |
| **GPT2-M (2FT)** | ~0.400 | ~0.470 |
| **GPT2-M (5FT)** | ~0.425 | ~0.485 |
---
## 4. Key Technical Observations
1. **Plugin Superiority:** In both BLEU and Rouge-L metrics, the "Plugin" configuration consistently outperforms the "Base" configuration across all training stages.
2. **Zeroshot Impact:** The most dramatic performance delta between Base and Plugin occurs in the "zeroshot" stage, particularly in the BLEU metric where the Base model is near zero while the Plugin model achieves a substantial score.
3. **Diminishing Returns:** While performance increases with more fine-tuning (from 1FT to 5FT), the rate of improvement slows down significantly after the first fine-tuning stage (1FT) for both metrics.
4. **Metric Scaling:** Rouge-L values are generally higher than BLEU values for the same model configurations, with the Plugin model approaching a 0.50 Rouge-L score at 5FT.