## Line Chart: Performance vs. Recurrence at Test-Time
### Overview
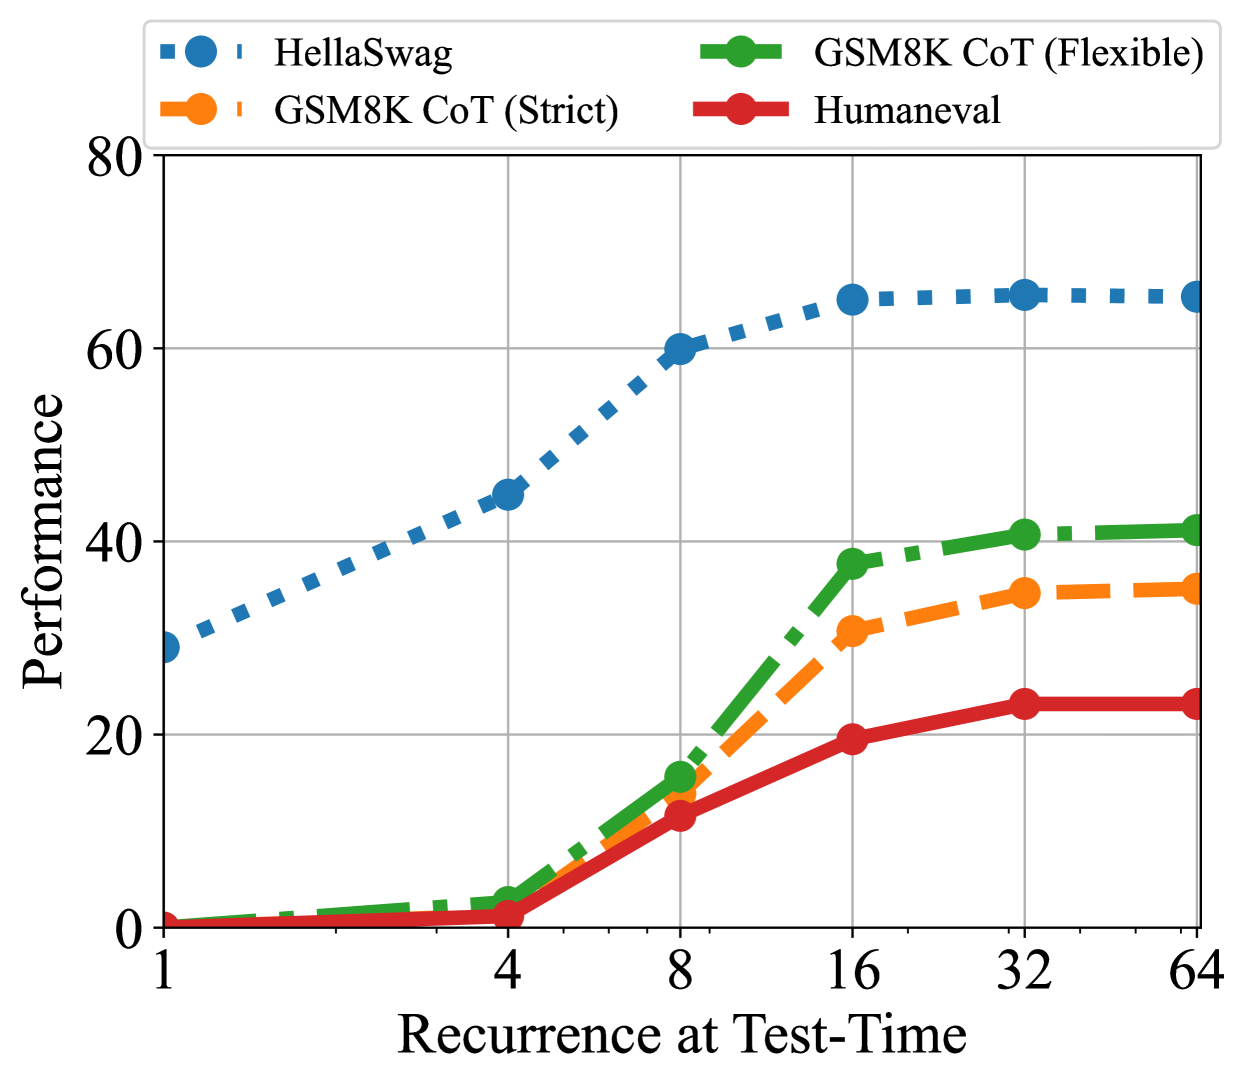
This line chart depicts the performance of four different models – HellaSwag, GSM8K CoT (Strict), GSM8K CoT (Flexible), and Humaneval – as a function of the recurrence depth at test-time. Performance is measured on the y-axis, and recurrence depth is on the x-axis, both on a logarithmic scale. The chart illustrates how performance changes as the models are allowed to recur more times during testing.
### Components/Axes
* **X-axis:** "Recurrence at Test-Time" with markers at 1, 4, 8, 16, 32, and 64.
* **Y-axis:** "Performance" ranging from 0 to 80.
* **Legend:** Located at the top-right corner of the chart.
* HellaSwag (Blue dashed line with circle markers)
* GSM8K CoT (Strict) (Orange dashed line with square markers)
* GSM8K CoT (Flexible) (Green solid line with circle markers)
* Humaneval (Red solid line with circle markers)
* **Gridlines:** Present to aid in reading values.
### Detailed Analysis
Here's a breakdown of each model's performance trend and approximate data points:
* **HellaSwag (Blue, dashed, circle):** The line slopes upward sharply initially, then plateaus.
* Recurrence = 1: Performance ≈ 28
* Recurrence = 4: Performance ≈ 44
* Recurrence = 8: Performance ≈ 58
* Recurrence = 16: Performance ≈ 64
* Recurrence = 32: Performance ≈ 66
* Recurrence = 64: Performance ≈ 68
* **GSM8K CoT (Strict) (Orange, dashed, square):** The line shows an initial increase, then levels off, with some fluctuations.
* Recurrence = 1: Performance ≈ 5
* Recurrence = 4: Performance ≈ 15
* Recurrence = 8: Performance ≈ 25
* Recurrence = 16: Performance ≈ 35
* Recurrence = 32: Performance ≈ 37
* Recurrence = 64: Performance ≈ 38
* **GSM8K CoT (Flexible) (Green, solid, circle):** The line starts low, increases rapidly, and then plateaus.
* Recurrence = 1: Performance ≈ 1
* Recurrence = 4: Performance ≈ 10
* Recurrence = 8: Performance ≈ 28
* Recurrence = 16: Performance ≈ 40
* Recurrence = 32: Performance ≈ 43
* Recurrence = 64: Performance ≈ 45
* **Humaneval (Red, solid, circle):** The line shows a steady, but relatively slow, increase.
* Recurrence = 1: Performance ≈ 2
* Recurrence = 4: Performance ≈ 8
* Recurrence = 8: Performance ≈ 15
* Recurrence = 16: Performance ≈ 22
* Recurrence = 32: Performance ≈ 26
* Recurrence = 64: Performance ≈ 28
### Key Observations
* HellaSwag consistently outperforms the other models across all recurrence depths.
* GSM8K CoT (Strict) shows a moderate improvement with increasing recurrence, but remains significantly lower than HellaSwag.
* GSM8K CoT (Flexible) demonstrates a more substantial improvement with recurrence than the "Strict" version, but still lags behind HellaSwag.
* Humaneval exhibits the slowest performance growth with increasing recurrence.
* All models show diminishing returns in performance gains as recurrence depth increases beyond 16.
### Interpretation
The chart suggests that allowing models to recur at test-time can improve their performance, but the extent of the improvement varies significantly depending on the model architecture and training methodology. HellaSwag appears to be particularly well-suited to benefit from recurrence, achieving high performance even at low recurrence depths and exhibiting a relatively stable performance level as recurrence increases. The difference between GSM8K CoT (Strict) and GSM8K CoT (Flexible) indicates that a more flexible approach to chain-of-thought reasoning can lead to better performance with recurrence. Humaneval's slower growth suggests that its underlying capabilities may be less sensitive to the benefits of recurrence, or that it requires a different approach to leverage this technique effectively. The diminishing returns observed at higher recurrence depths suggest that there is a limit to the benefits of allowing models to recur indefinitely, and that optimizing other aspects of the model or training process may be more effective at improving performance beyond a certain point. The logarithmic scale of the x-axis emphasizes the rapid gains achieved at lower recurrence depths, and the flattening of the curves at higher depths.