## Line Chart: Model Accuracy vs. Reasoning Complexity
### Overview
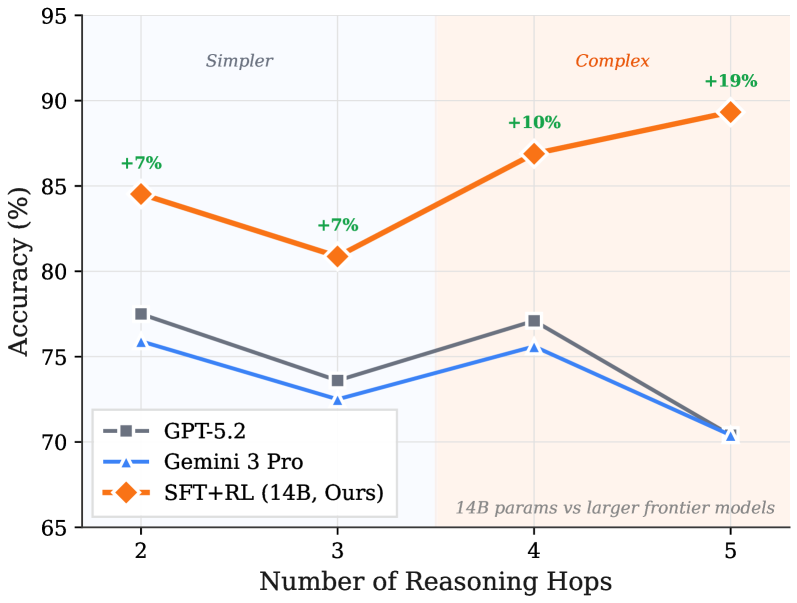
The image is a line chart comparing the accuracy of three different AI models across an increasing number of reasoning steps. The chart is divided into two distinct background regions, "Simpler" and "Complex," to contextualize the difficulty of the tasks. The primary finding is that the model labeled "SFT+RL (14B, Ours)" demonstrates superior and improving performance as task complexity increases, while the two comparison models show declining or stagnant performance.
### Components/Axes
* **Chart Type:** Multi-series line chart.
* **X-Axis:** Labeled **"Number of Reasoning Hops"**. It has four discrete, evenly spaced tick marks at values **2, 3, 4, and 5**.
* **Y-Axis:** Labeled **"Accuracy (%)"**. The scale runs from **65 to 95**, with major gridlines at intervals of 5% (65, 70, 75, 80, 85, 90, 95).
* **Legend:** Located in the **bottom-left corner**. It contains three entries:
1. **GPT-5.2**: Represented by a **gray line with square markers**.
2. **Gemini 3 Pro**: Represented by a **blue line with upward-pointing triangle markers**.
3. **SFT+RL (14B, Ours)**: Represented by an **orange line with diamond markers**.
* **Background Regions:**
* **"Simpler"**: A light blue shaded region covering the area from x=2 to just before x=4.
* **"Complex"**: A light orange shaded region covering the area from x=4 to x=5.
* **Annotations:**
* Green percentage values (**+7%, +7%, +10%, +19%**) are placed directly above the data points of the orange "SFT+RL" line.
* A text note in the **bottom-right corner** of the "Complex" region reads: **"14B params vs larger frontier models"**.
### Detailed Analysis
**Data Series and Trends:**
1. **SFT+RL (14B, Ours) - Orange Line with Diamonds:**
* **Trend:** Shows a slight initial dip followed by a strong, consistent upward trend. It is the only model that improves with more reasoning hops.
* **Data Points (Approximate):**
* At 2 Hops: **~84.5%** (Annotated: +7%)
* At 3 Hops: **~81.0%** (Annotated: +7%)
* At 4 Hops: **~87.0%** (Annotated: +10%)
* At 5 Hops: **~89.5%** (Annotated: +19%)
2. **GPT-5.2 - Gray Line with Squares:**
* **Trend:** Fluctuates. It decreases from 2 to 3 hops, recovers at 4 hops, then drops sharply at 5 hops. Overall trend is slightly downward.
* **Data Points (Approximate):**
* At 2 Hops: **~77.5%**
* At 3 Hops: **~73.5%**
* At 4 Hops: **~77.0%**
* At 5 Hops: **~70.5%**
3. **Gemini 3 Pro - Blue Line with Triangles:**
* **Trend:** Follows a very similar pattern to GPT-5.2 but consistently at a slightly lower accuracy level. Decreases from 2 to 3 hops, recovers at 4 hops, then drops at 5 hops.
* **Data Points (Approximate):**
* At 2 Hops: **~76.0%**
* At 3 Hops: **~72.5%**
* At 4 Hops: **~75.5%**
* At 5 Hops: **~70.5%** (Converges with GPT-5.2)
### Key Observations
* **Performance Gap:** The "SFT+RL" model maintains a significant accuracy lead over the other two models at all data points. The gap widens dramatically in the "Complex" region (4-5 hops).
* **Divergent Trajectories:** At 4 and 5 reasoning hops, the performance of the models diverges sharply. While "SFT+RL" climbs, both "GPT-5.2" and "Gemini 3 Pro" decline.
* **Convergence at High Complexity:** At the highest complexity shown (5 hops), the two frontier models, GPT-5.2 and Gemini 3 Pro, converge to nearly identical low accuracy (~70.5%).
* **Annotation Context:** The green "+X%" annotations likely represent the performance improvement of "SFT+RL" over a baseline (possibly the average of the other two models) at each hop count. The note "14B params vs larger frontier models" highlights that the superior model is significantly smaller in parameter count.
### Interpretation
This chart presents a compelling case for the effectiveness of the "SFT+RL" training methodology (likely Supervised Fine-Tuning + Reinforcement Learning) on a 14-billion parameter model. The data suggests that this approach confers a specific advantage in **multi-step reasoning tasks**.
* **Scalability with Complexity:** The core insight is that the "SFT+RL" model's capability *scales positively* with task difficulty (more reasoning hops), whereas the larger "frontier" models struggle. This implies the training method improves the model's robustness and logical chaining ability, not just its knowledge retrieval.
* **Efficiency Argument:** The annotation about parameter count frames this as an efficiency breakthrough. It challenges the assumption that larger models are always superior, demonstrating that a smaller, well-trained model can outperform larger ones on complex cognitive tasks.
* **Practical Implication:** For applications requiring deep, multi-step analysis (e.g., complex QA, planning, scientific reasoning), the "SFT+RL" approach appears more promising than simply using a larger general-purpose model. The chart argues for targeted training methodologies over sheer scale for specific capabilities.
* **Underlying Pattern:** The dip at 3 hops for all models is an interesting anomaly. It could indicate a specific threshold in reasoning difficulty where all models initially struggle before different training methodologies allow some to adapt and overcome it at 4+ hops.