TECHNICAL ASSET FINGERPRINT
b3d36f798f6f37844bec5a3d
Click to view fullscreen
Press ESC or click to close
FOUND IN PAPERS
EXPERT: gemini-2.0-flash VERSION 1
RUNTIME: nugit/gemini/gemini-2.0-flash
INTEL_VERIFIED
## Neural Network Architecture and Performance Radar Charts
### Overview
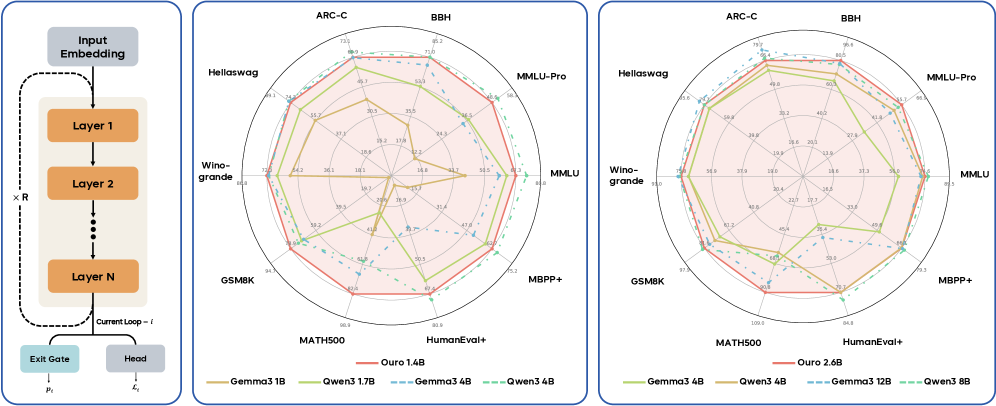
The image presents a neural network architecture diagram alongside two radar charts comparing the performance of different language models on various benchmarks. The diagram illustrates the recurrent structure of the network, while the radar charts visualize the performance of models with different parameter sizes on tasks like ARC-C, BBH, MMLU, and others.
### Components/Axes
**Diagram (Left)**
* **Input Embedding:** Topmost block, representing the input to the network.
* **Layer 1, Layer 2, Layer N:** Stacked blocks representing the recurrent layers of the network. The "Layer N" block indicates that there are multiple layers.
* **x R:** Indicates the recurrent application of the layers.
* **Current Loop - l:** A dashed arrow looping back from Layer N to Layer 1, indicating the recurrent connection.
* **Exit Gate:** A block at the bottom, representing the output gate of the network, labeled with μl.
* **Head:** A block at the bottom, representing the output head of the network, labeled with ℓl.
**Radar Charts (Center and Right)**
* **Axes:** The radar charts have axes representing different benchmarks: ARC-C, BBH, MMLU-Pro, MMLU, MBPP+, HumanEval+, MATH500, GSM8K, Wino-grande, Hellaswag.
* **Scale:** The radial scale ranges from approximately 0 to 100, with intermediate values marked.
* **Legend (Bottom):**
* Ouro 1.4B (Red solid line)
* Gemma3 1B (Yellow solid line)
* Qwen3 1.7B (Light Green solid line)
* Gemma3 4B (Blue dashed line)
* Qwen3 4B (Teal dashed line)
* Ouro 2.6B (Red solid line)
* Gemma3 4B (Yellow solid line)
* Qwen3 4B (Light Green solid line)
* Gemma3 12B (Blue dashed line)
* Qwen3 8B (Teal dashed line)
### Detailed Analysis
**Radar Chart 1 (Center): Performance of Ouro 1.4B, Gemma3 1B, Qwen3 1.7B, Gemma3 4B, Qwen3 4B**
* **Ouro 1.4B (Red solid line):** Generally shows mid-range performance across all benchmarks.
* ARC-C: ~69
* BBH: ~71
* MMLU-Pro: ~66
* MMLU: ~50
* MBPP+: ~79
* HumanEval+: ~82
* MATH500: ~90
* GSM8K: ~94
* Wino-grande: ~72
* Hellaswag: ~74
* **Gemma3 1B (Yellow solid line):** Shows lower performance compared to other models, especially on MMLU and BBH.
* ARC-C: ~36
* BBH: ~24
* MMLU-Pro: ~42
* MMLU: ~18
* MBPP+: ~34
* HumanEval+: ~39
* MATH500: ~40
* GSM8K: ~54
* Wino-grande: ~54
* Hellaswag: ~56
* **Qwen3 1.7B (Light Green solid line):** Performance is generally better than Gemma3 1B but lower than Ouro 1.4B.
* ARC-C: ~55
* BBH: ~53
* MMLU-Pro: ~60
* MMLU: ~37
* MBPP+: ~50
* HumanEval+: ~50
* MATH500: ~63
* GSM8K: ~72
* Wino-grande: ~66
* Hellaswag: ~69
* **Gemma3 4B (Blue dashed line):** Shows higher performance than Gemma3 1B and Qwen3 1.7B, approaching Ouro 1.4B on some benchmarks.
* ARC-C: ~60
* BBH: ~68
* MMLU-Pro: ~65
* MMLU: ~44
* MBPP+: ~62
* HumanEval+: ~64
* MATH500: ~66
* GSM8K: ~75
* Wino-grande: ~69
* Hellaswag: ~70
* **Qwen3 4B (Teal dashed line):** Performance is similar to Gemma3 4B.
* ARC-C: ~50
* BBH: ~56
* MMLU-Pro: ~57
* MMLU: ~35
* MBPP+: ~47
* HumanEval+: ~47
* MATH500: ~58
* GSM8K: ~68
* Wino-grande: ~60
* Hellaswag: ~60
**Radar Chart 2 (Right): Performance of Ouro 2.6B, Gemma3 4B, Qwen3 4B, Gemma3 12B, Qwen3 8B**
* **Ouro 2.6B (Red solid line):** Shows the highest performance across most benchmarks.
* ARC-C: ~75
* BBH: ~80
* MMLU-Pro: ~85
* MMLU: ~65
* MBPP+: ~86
* HumanEval+: ~85
* MATH500: ~100
* GSM8K: ~97
* Wino-grande: ~75
* Hellaswag: ~79
* **Gemma3 4B (Yellow solid line):** Shows lower performance compared to other models, especially on MMLU and BBH.
* ARC-C: ~38
* BBH: ~28
* MMLU-Pro: ~40
* MMLU: ~20
* MBPP+: ~37
* HumanEval+: ~35
* MATH500: ~40
* GSM8K: ~57
* Wino-grande: ~57
* Hellaswag: ~59
* **Qwen3 4B (Light Green solid line):** Performance is generally better than Gemma3 4B but lower than Ouro 2.6B.
* ARC-C: ~59
* BBH: ~60
* MMLU-Pro: ~61
* MMLU: ~42
* MBPP+: ~50
* HumanEval+: ~49
* MATH500: ~61
* GSM8K: ~75
* Wino-grande: ~70
* Hellaswag: ~70
* **Gemma3 12B (Blue dashed line):** Shows higher performance than Gemma3 4B and Qwen3 4B, approaching Ouro 2.6B on some benchmarks.
* ARC-C: ~65
* BBH: ~69
* MMLU-Pro: ~70
* MMLU: ~50
* MBPP+: ~62
* HumanEval+: ~60
* MATH500: ~70
* GSM8K: ~80
* Wino-grande: ~70
* Hellaswag: ~75
* **Qwen3 8B (Teal dashed line):** Performance is similar to Gemma3 12B.
* ARC-C: ~50
* BBH: ~55
* MMLU-Pro: ~55
* MMLU: ~37
* MBPP+: ~49
* HumanEval+: ~45
* MATH500: ~55
* GSM8K: ~65
* Wino-grande: ~65
* Hellaswag: ~65
### Key Observations
* **Model Size Matters:** Larger models (e.g., Ouro 2.6B, Gemma3 12B, Qwen3 8B) generally outperform smaller models (e.g., Gemma3 1B, Qwen3 1.7B) across all benchmarks.
* **Ouro Models Lead:** The Ouro models (1.4B and 2.6B) tend to achieve higher performance compared to Gemma and Qwen models with similar parameter sizes.
* **Benchmark Sensitivity:** Model performance varies across different benchmarks, indicating that some tasks are more challenging than others. For example, all models show relatively lower performance on MMLU compared to MATH500.
* **Recurrent Architecture:** The diagram highlights the recurrent nature of the network, which allows it to process sequential data effectively.
### Interpretation
The data suggests that increasing model size and potentially architectural choices (as seen with the Ouro models) lead to improved performance on a variety of language understanding and reasoning tasks. The recurrent architecture diagram provides context for understanding how these models process information. The radar charts offer a visual comparison of model performance across different benchmarks, highlighting the strengths and weaknesses of each model. The performance differences between models on different benchmarks suggest that certain tasks may require specific architectural or training modifications to achieve optimal results.
DECODING INTELLIGENCE...