TECHNICAL ASSET FINGERPRINT
b3d36f798f6f37844bec5a3d
Click to view fullscreen
Press ESC or click to close
FOUND IN PAPERS
EXPERT: gemma-3-27b-it-free VERSION 1
RUNTIME: google-free/gemma-3-27b-it
INTEL_VERIFIED
## Radar Charts with Neural Network Diagram: Model Performance Comparison
### Overview
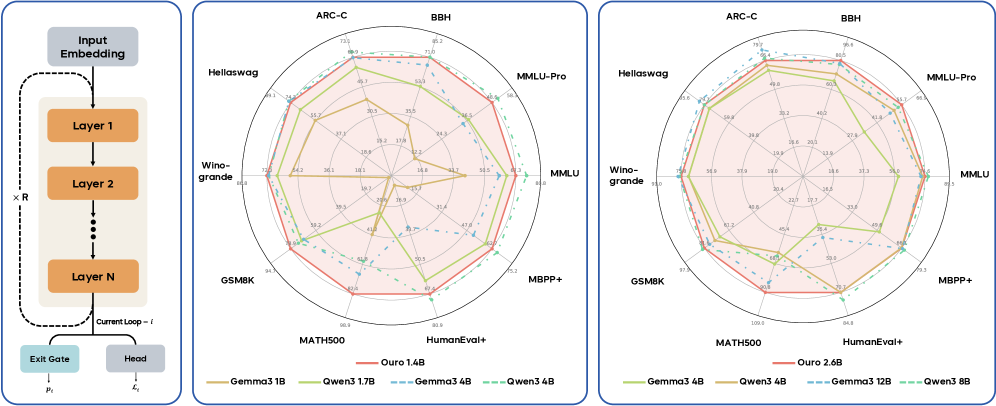
The image presents a comparison of several language models (Ouro, Gemma, Owen) across various benchmark tasks. The comparison is visualized using two radar charts, each displaying the performance of the models on a set of benchmarks. A neural network diagram is included on the left, illustrating the architecture of the models being evaluated.
### Components/Axes
The image consists of three main components:
1. **Neural Network Diagram:** Located on the left, it depicts a recurrent neural network with "Input Embedding", "Layer 1", "Layer 2", ..., "Layer N", "Exit Gate", and "Head" as key components. The diagram also includes annotations for "Current Loop - i", "x R", "pᵢ", and "fᵢ".
2. **Radar Chart 1:** Located in the center, it displays performance metrics for several models across benchmarks like ARC-C, BBH, Hellaswag, Winogrande, GSM8K, MMLU, MMLU-Pro, MBPP+, and MATH500, HumanEval+.
3. **Radar Chart 2:** Located on the right, it displays performance metrics for a different set of models across the same benchmarks as Radar Chart 1.
The radar charts use a radial scale, with values ranging from approximately 0 to 100, indicated by concentric circles. The benchmarks are positioned around the circumference of the circle.
### Detailed Analysis or Content Details
**Neural Network Diagram:**
* The diagram shows a recurrent neural network structure.
* "Input Embedding" feeds into "Layer 1".
* Layers are repeated "x R" times, up to "Layer N".
* "Layer N" connects to "Exit Gate" and "Head".
* Annotations: "Current Loop - i", "x R", "pᵢ", and "fᵢ" are present, likely representing loop iteration, repetition factor, and parameters.
**Radar Chart 1:**
* **Benchmarks:** ARC-C, BBH, Hellaswag, Winogrande, GSM8K, MMLU, MMLU-Pro, MBPP+, MATH500, HumanEval+.
* **Models & Colors:**
* Ouro 1.4B (Blue) - Generally performs well across all benchmarks, with peaks around 60-70 for Hellaswag, Winogrande, and GSM8K. Around 30 for MATH500.
* Ouro 2.6B (Orange) - Shows improvement over Ouro 1.4B, peaking around 70-80 for Hellaswag, Winogrande, and GSM8K. Around 40 for MATH500.
* Gemma 3B (Green) - Performs consistently, with peaks around 60-70 for Hellaswag, Winogrande, and GSM8K. Around 30 for MATH500.
* Gemma 3.4B (Yellow) - Similar to Gemma 3B, with slight variations.
* Gemma 4B (Light Green) - Shows slight improvement over Gemma 3B and 3.4B.
* Owen 3.1B (Teal) - Performs well on Hellaswag and Winogrande (around 70-80), but lower on others.
* **Approximate Values (read from chart):**
* ARC-C: Ouro 1.4B ~ 30, Ouro 2.6B ~ 40, Gemma 3B ~ 30, Owen 3.1B ~ 20
* BBH: Ouro 1.4B ~ 30, Ouro 2.6B ~ 40, Gemma 3B ~ 30, Owen 3.1B ~ 20
* Hellaswag: Ouro 1.4B ~ 65, Ouro 2.6B ~ 75, Gemma 3B ~ 60, Owen 3.1B ~ 70
* Winogrande: Ouro 1.4B ~ 60, Ouro 2.6B ~ 70, Gemma 3B ~ 60, Owen 3.1B ~ 70
* GSM8K: Ouro 1.4B ~ 60, Ouro 2.6B ~ 70, Gemma 3B ~ 60, Owen 3.1B ~ 60
* MMLU: Ouro 1.4B ~ 40, Ouro 2.6B ~ 50, Gemma 3B ~ 40, Owen 3.1B ~ 30
* MMLU-Pro: Ouro 1.4B ~ 30, Ouro 2.6B ~ 40, Gemma 3B ~ 30, Owen 3.1B ~ 20
* MBPP+: Ouro 1.4B ~ 30, Ouro 2.6B ~ 40, Gemma 3B ~ 30, Owen 3.1B ~ 20
* MATH500: Ouro 1.4B ~ 30, Ouro 2.6B ~ 40, Gemma 3B ~ 30, Owen 3.1B ~ 20
* HumanEval+: Ouro 1.4B ~ 30, Ouro 2.6B ~ 40, Gemma 3B ~ 30, Owen 3.1B ~ 20
**Radar Chart 2:**
* **Benchmarks:** Same as Radar Chart 1.
* **Models & Colors:**
* Gemma 3.4B (Yellow) - Similar performance to Gemma 3B.
* Gemma 4B (Light Green) - Shows slight improvement over Gemma 3.4B.
* Gemma 8B (Dark Green) - Generally performs better than smaller Gemma models, peaking around 70-80 for Hellaswag, Winogrande, and GSM8K.
* Ouro 1.4B (Blue) - Similar performance to Radar Chart 1.
* Ouro 2.6B (Orange) - Similar performance to Radar Chart 1.
* Owen 3.1B (Teal) - Similar performance to Radar Chart 1.
* **Approximate Values (read from chart):**
* ARC-C: Gemma 3.4B ~ 30, Gemma 4B ~ 35, Gemma 8B ~ 40, Ouro 1.4B ~ 30, Ouro 2.6B ~ 40, Owen 3.1B ~ 20
* BBH: Gemma 3.4B ~ 30, Gemma 4B ~ 35, Gemma 8B ~ 40, Ouro 1.4B ~ 30, Ouro 2.6B ~ 40, Owen 3.1B ~ 20
* Hellaswag: Gemma 3.4B ~ 60, Gemma 4B ~ 65, Gemma 8B ~ 75, Ouro 1.4B ~ 65, Ouro 2.6B ~ 75, Owen 3.1B ~ 70
* Winogrande: Gemma 3.4B ~ 60, Gemma 4B ~ 65, Gemma 8B ~ 75, Ouro 1.4B ~ 60, Ouro 2.6B ~ 70, Owen 3.1B ~ 70
* GSM8K: Gemma 3.4B ~ 60, Gemma 4B ~ 65, Gemma 8B ~ 75, Ouro 1.4B ~ 60, Ouro 2.6B ~ 70, Owen 3.1B ~ 60
* MMLU: Gemma 3.4B ~ 40, Gemma 4B ~ 45, Gemma 8B ~ 50, Ouro 1.4B ~ 40, Ouro 2.6B ~ 50, Owen 3.1B ~ 30
* MMLU-Pro: Gemma 3.4B ~ 30, Gemma 4B ~ 35, Gemma 8B ~ 40, Ouro 1.4B ~ 30, Ouro 2.6B ~ 40, Owen 3.1B ~ 20
* MBPP+: Gemma 3.4B ~ 30, Gemma 4B ~ 35, Gemma 8B ~ 40, Ouro 1.4B ~ 30, Ouro 2.6B ~ 40, Owen 3.1B ~ 20
* MATH500: Gemma 3.4B ~ 30, Gemma 4B ~ 35, Gemma 8B ~ 40, Ouro 1.4B ~ 30, Ouro 2.6B ~ 40, Owen 3.1B ~ 20
* HumanEval+: Gemma 3.4B ~ 30, Gemma 4B ~ 35, Gemma 8B ~ 40, Ouro 1.4B ~ 30, Ouro 2.6B ~ 40, Owen 3.1B ~ 20
### Key Observations
* Larger models (Gemma 8B, Ouro 2.6B) generally outperform smaller models across most benchmarks.
* Owen 3.1B performs well on Hellaswag and Winogrande but lags behind on other benchmarks.
* MATH500 consistently shows the lowest scores across all models.
* The performance difference between Gemma 3.4B and Gemma 4B is relatively small.
* The neural network diagram suggests a standard recurrent architecture, likely a transformer-based model.
### Interpretation
The radar charts demonstrate the performance trade-offs between different language models on a variety of tasks. The consistent trend of larger models achieving higher scores suggests that model size is a significant factor in performance. The neural network diagram provides context, indicating that these models are likely based on a recurrent architecture. The low scores on MATH500 suggest that these models struggle with mathematical reasoning. The comparison between Ouro and Gemma models highlights the impact of different training data and architectures on performance. The consistent performance of Ouro 2.6B and Gemma 8B suggests they are competitive models. The positioning of the benchmarks around the radar chart reveals that the models exhibit varying strengths and weaknesses across different types of reasoning and knowledge. The charts provide a valuable visual summary of the models' capabilities, allowing for informed comparisons and selection based on specific application requirements.
DECODING INTELLIGENCE...