## Bar Charts: AIME Benchmarks, Training Cost, and Training Data
### Overview
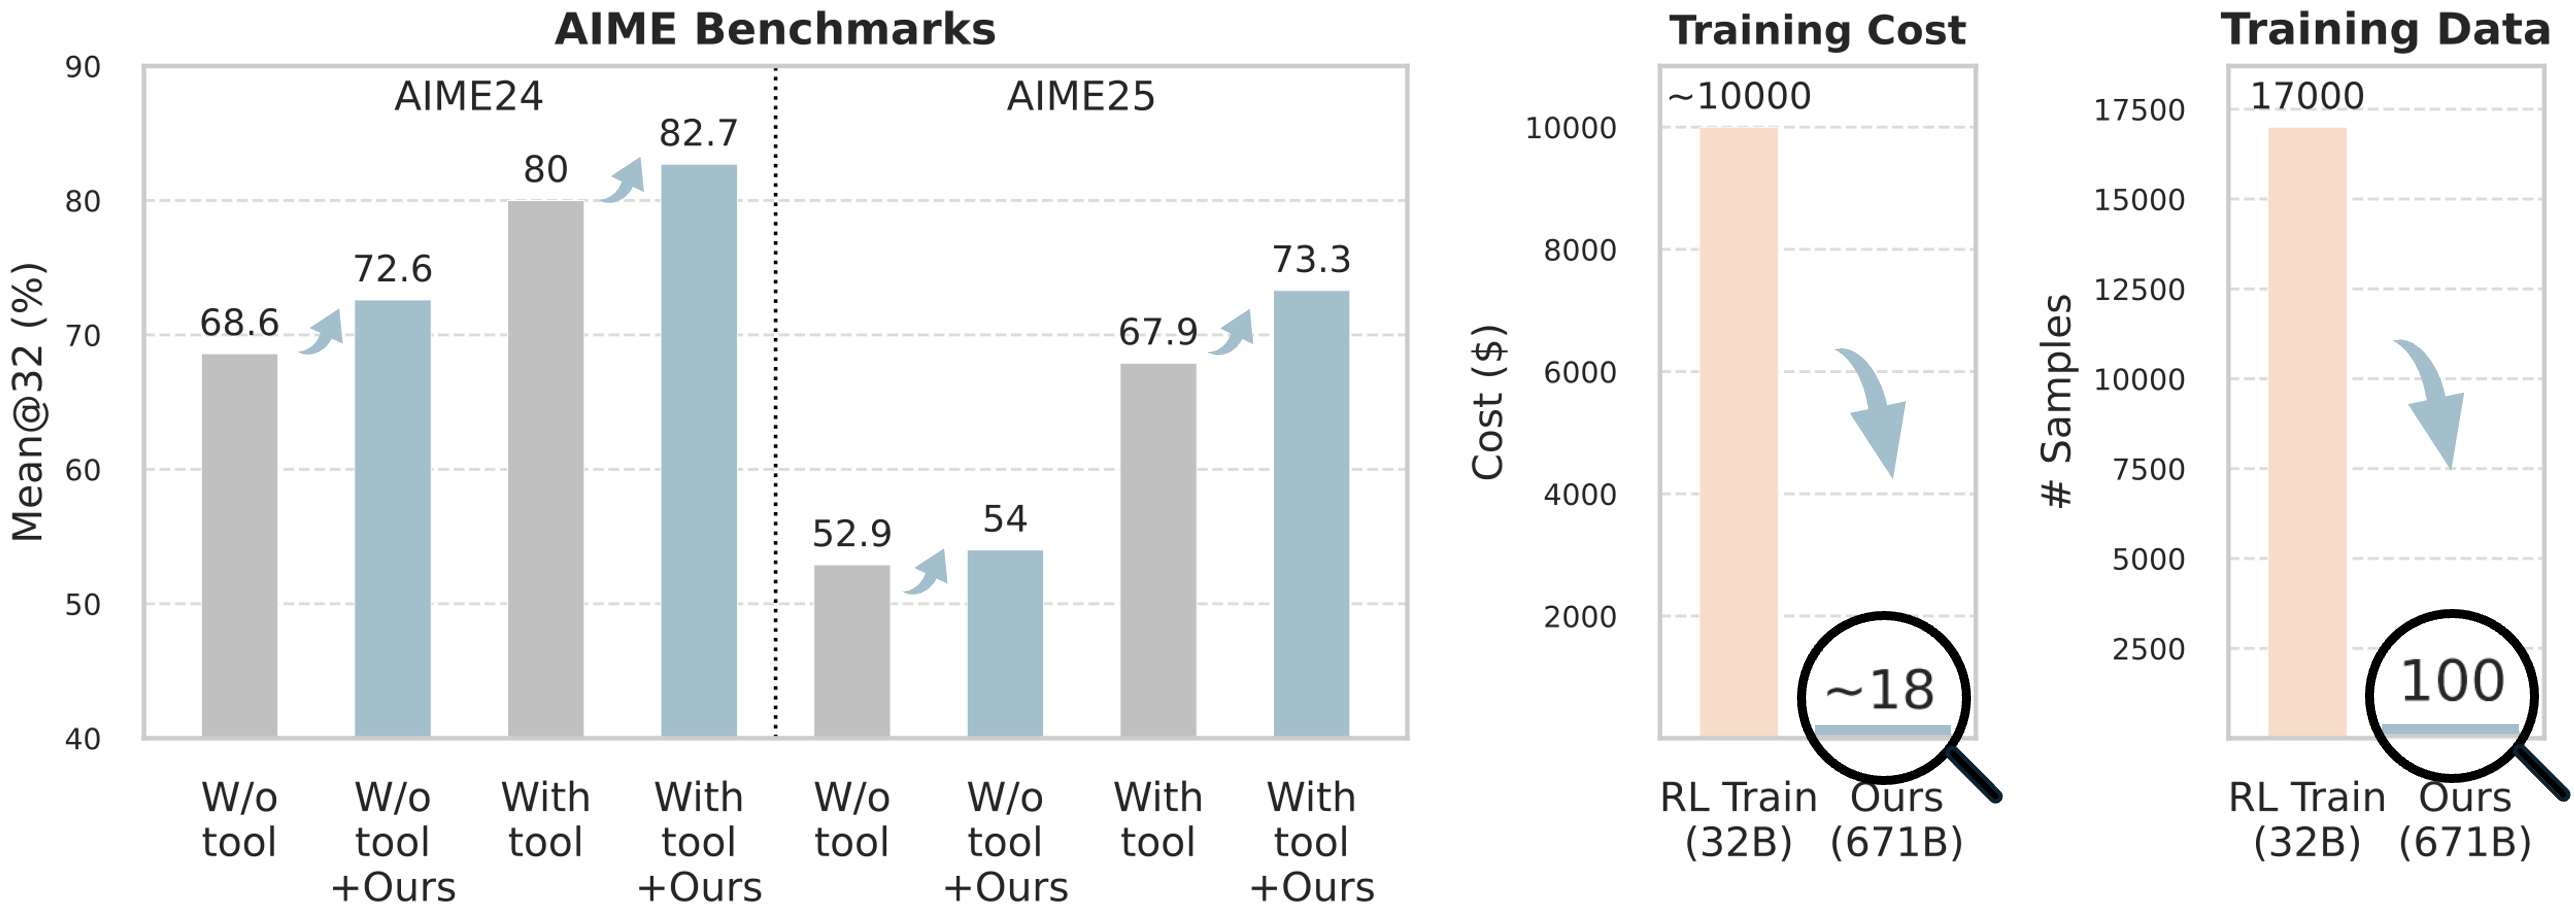
The image presents three bar charts comparing the performance of a system with and without a tool, and comparing the training cost and data. The first chart, "AIME Benchmarks," shows the "Mean@32 (%)" for two datasets, AIME24 and AIME25, with and without the tool. The second chart, "Training Cost," compares the cost of "RL Train (32B)" and "Ours (671B)." The third chart, "Training Data," compares the number of samples for "RL Train (32B)" and "Ours (671B)."
### Components/Axes
**AIME Benchmarks Chart:**
* **Title:** AIME Benchmarks
* **Y-axis:** Mean@32 (%)
* Scale: 40 to 90, incrementing by 10
* **X-axis:** Categorical, divided into AIME24 and AIME25
* AIME24: W/o tool, W/o tool +Ours, With tool, With tool +Ours
* AIME25: W/o tool, W/o tool +Ours, With tool, With tool +Ours
* **Bar Colors:** Grey (W/o tool, With tool), Light Blue (W/o tool +Ours, With tool +Ours)
**Training Cost Chart:**
* **Title:** Training Cost
* **Y-axis:** Cost ($)
* Scale: 0 to 10000, incrementing by 2000
* **X-axis:** Categorical
* RL Train (32B), Ours (671B)
* **Bar Colors:** Light Orange (RL Train (32B)), Light Blue (Ours (671B))
**Training Data Chart:**
* **Title:** Training Data
* **Y-axis:** # Samples
* Scale: 0 to 17500, incrementing by 2500
* **X-axis:** Categorical
* RL Train (32B), Ours (671B)
* **Bar Colors:** Light Orange (RL Train (32B)), Light Blue (Ours (671B))
### Detailed Analysis
**AIME Benchmarks Chart:**
* **AIME24:**
* W/o tool: 68.6
* W/o tool +Ours: 72.6
* With tool: 80
* With tool +Ours: 82.7
* **AIME25:**
* W/o tool: 52.9
* W/o tool +Ours: 54
* With tool: 67.9
* With tool +Ours: 73.3
**Training Cost Chart:**
* RL Train (32B): ~10000
* Ours (671B): ~18
**Training Data Chart:**
* RL Train (32B): 17000
* Ours (671B): 100
### Key Observations
* In the AIME Benchmarks chart, the "Ours" system consistently outperforms the baseline in both AIME24 and AIME25 datasets, regardless of whether a tool is used.
* The Training Cost for "Ours (671B)" is significantly lower (~18) than "RL Train (32B)" (~10000).
* The Training Data for "Ours (671B)" is significantly lower (100) than "RL Train (32B)" (17000).
### Interpretation
The data suggests that the "Ours (671B)" system achieves better performance (higher Mean@32) with significantly lower training cost and data requirements compared to the "RL Train (32B)" system. This indicates that the "Ours" system is more efficient in terms of resource utilization while maintaining or improving accuracy. The AIME benchmark results show that the "Ours" system consistently improves performance, whether or not a tool is used, suggesting that it is a robust and effective approach. The arrows pointing down from the RL Train bars to the Ours bars visually emphasize the reduction in cost and data.