## Bar Charts: AIME Benchmark Performance, Training Cost, and Training Data Comparison
### Overview
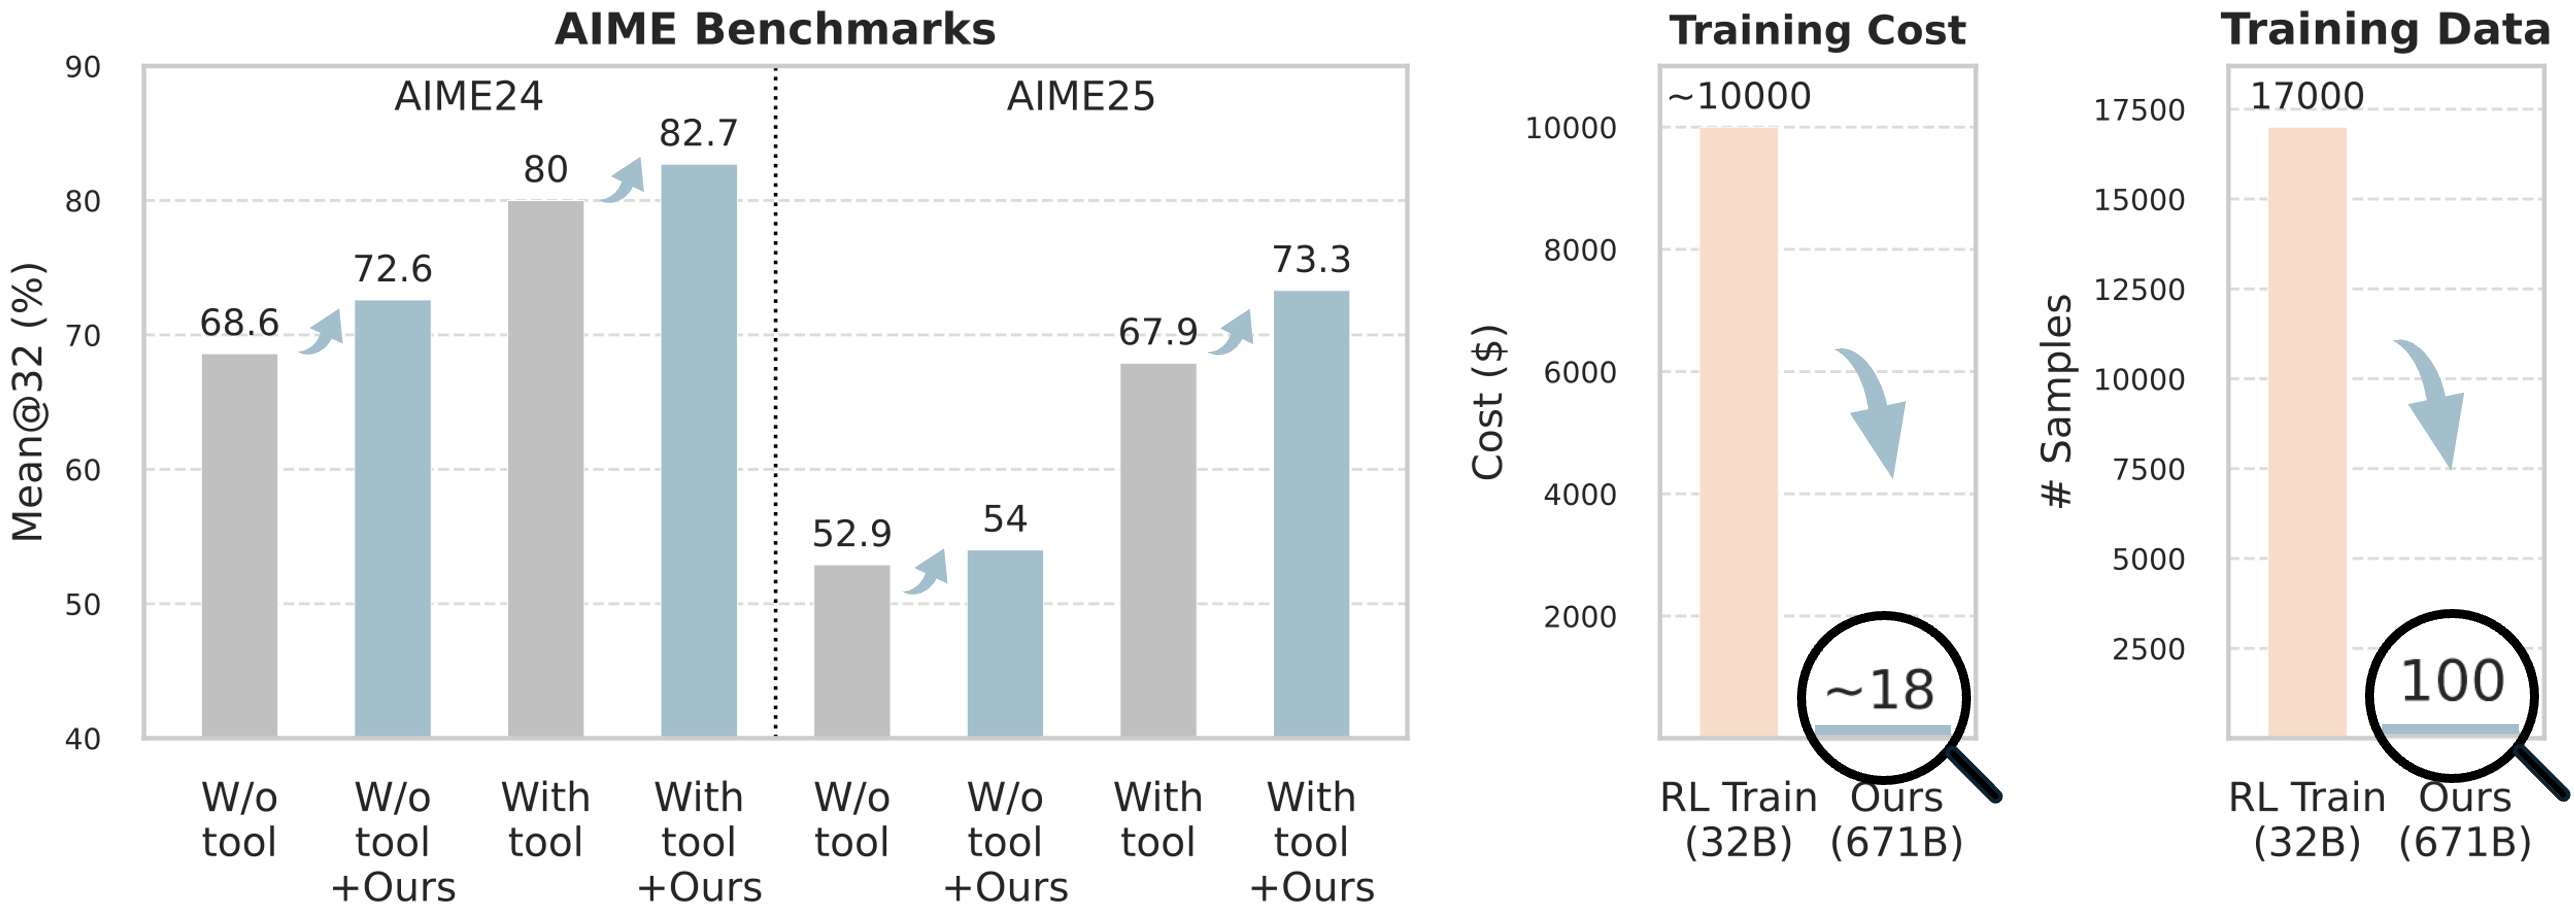
The image contains three distinct bar charts arranged horizontally. The leftmost and largest chart compares model performance on AIME benchmarks for two years (AIME24 and AIME25) under four different conditions. The middle chart compares the training cost in US dollars between two models. The rightmost chart compares the number of training data samples required by the same two models. The overall visual narrative demonstrates significant performance improvements and dramatic reductions in cost and data requirements for a method labeled "Ours."
### Components/Axes
**1. AIME Benchmarks Chart (Left)**
* **Title:** AIME Benchmarks
* **Y-axis:** Label: `Mean@32 (%)`. Scale: 40 to 90, with increments of 10.
* **X-axis:** Two main groups: `AIME24` and `AIME25`. Each group contains four bars.
* **Bar Categories (X-axis labels, left to right within each year group):**
1. `W/o tool` (Gray bar)
2. `W/o tool +Ours` (Light blue bar)
3. `With tool` (Gray bar)
4. `With tool +Ours` (Light blue bar)
* **Legend/Key:** Implicit from bar color and label. Gray bars represent baseline conditions ("W/o tool" or "With tool"). Light blue bars represent the same condition with the addition of the proposed method ("+Ours").
* **Visual Elements:** Light blue upward-curving arrows connect each gray baseline bar to its corresponding light blue "+Ours" bar, indicating improvement.
**2. Training Cost Chart (Middle)**
* **Title:** Training Cost
* **Y-axis:** Label: `Cost ($)`. Scale: 0 to 10000, with increments of 2000.
* **X-axis:** Two bars labeled:
1. `RL Train (32B)` (Light orange/peach bar)
2. `Ours (671B)` (Very short, light blue bar)
* **Visual Elements:** A large, light blue downward-curving arrow points from the top of the "RL Train" bar to the "Ours" bar. A magnifying glass graphic circles the value `~18` above the "Ours" bar, emphasizing its small size.
**3. Training Data Chart (Right)**
* **Title:** Training Data
* **Y-axis:** Label: `# Samples`. Scale: 0 to 17500, with increments of 2500.
* **X-axis:** Two bars labeled:
1. `RL Train (32B)` (Light orange/peach bar)
2. `Ours (671B)` (Very short, light blue bar)
* **Visual Elements:** A large, light blue downward-curving arrow points from the top of the "RL Train" bar to the "Ours" bar. A magnifying glass graphic circles the value `100` above the "Ours" bar, emphasizing its small size.
### Detailed Analysis
**AIME Benchmarks Data Points:**
* **AIME24:**
* `W/o tool`: 68.6%
* `W/o tool +Ours`: 72.6% (Increase of ~4.0 percentage points)
* `With tool`: 80.0%
* `With tool +Ours`: 82.7% (Increase of ~2.7 percentage points)
* **AIME25:**
* `W/o tool`: 52.9%
* `W/o tool +Ours`: 54.0% (Increase of ~1.1 percentage points)
* `With tool`: 67.9%
* `With tool +Ours`: 73.3% (Increase of ~5.4 percentage points)
**Training Cost Data Points:**
* `RL Train (32B)`: ~10000 (The bar reaches the 10000 line, and the label uses a tilde `~`).
* `Ours (671B)`: ~18 (Explicitly labeled with a tilde `~` inside a magnifying glass).
**Training Data Data Points:**
* `RL Train (32B)`: 17000 (The bar aligns with the 17000 grid line).
* `Ours (671B)`: 100 (Explicitly labeled inside a magnifying glass).
### Key Observations
1. **Consistent Performance Gain:** The "+Ours" method improves the Mean@32 score in all four tested scenarios (across both years and both tool-use conditions). The gains range from +1.1 to +5.4 percentage points.
2. **Higher Baseline with Tools:** Using tools (`With tool`) yields a substantially higher baseline performance than not using tools (`W/o tool`) in both years (e.g., 80.0% vs 68.6% in AIME24).
3. **Drastic Cost Reduction:** The training cost for "Ours (671B)" is approximately **$18**, compared to approximately **$10,000** for "RL Train (32B)". This represents a reduction of over 99.8%.
4. **Massive Data Efficiency:** The "Ours (671B)" model was trained on only **100 samples**, compared to **17,000 samples** for "RL Train (32B)". This is a 170x reduction in data volume.
5. **Model Size Paradox:** The "Ours" model is significantly larger (671B parameters) than the "RL Train" model (32B parameters), yet it achieves its results with vastly less data and cost.
### Interpretation
The charts collectively argue for the extreme efficiency and effectiveness of the proposed method ("Ours"). The data suggests that this method, when applied to a very large model (671B), can:
* **Boost Performance:** Consistently improve accuracy on challenging mathematical benchmarks (AIME), both with and without external tools.
* **Achieve Unprecedented Efficiency:** Do so while requiring **four orders of magnitude less financial cost** and **over two orders of magnitude less training data** than a standard reinforcement learning training approach on a smaller (32B) model.
The visual emphasis (magnifying glasses, dramatic downward arrows) highlights the most striking claim: that scaling up model size (to 671B) in conjunction with this specific method decouples performance from the traditional, resource-intensive requirements of large-scale training. The outlier is not a data point but the method itself—it presents a scenario where a much larger model is trained with trivial resources, challenging the common assumption that larger models always require proportionally more data and cost. The charts are designed to showcase a breakthrough in training efficiency.