## Line Chart: Warmup
### Overview
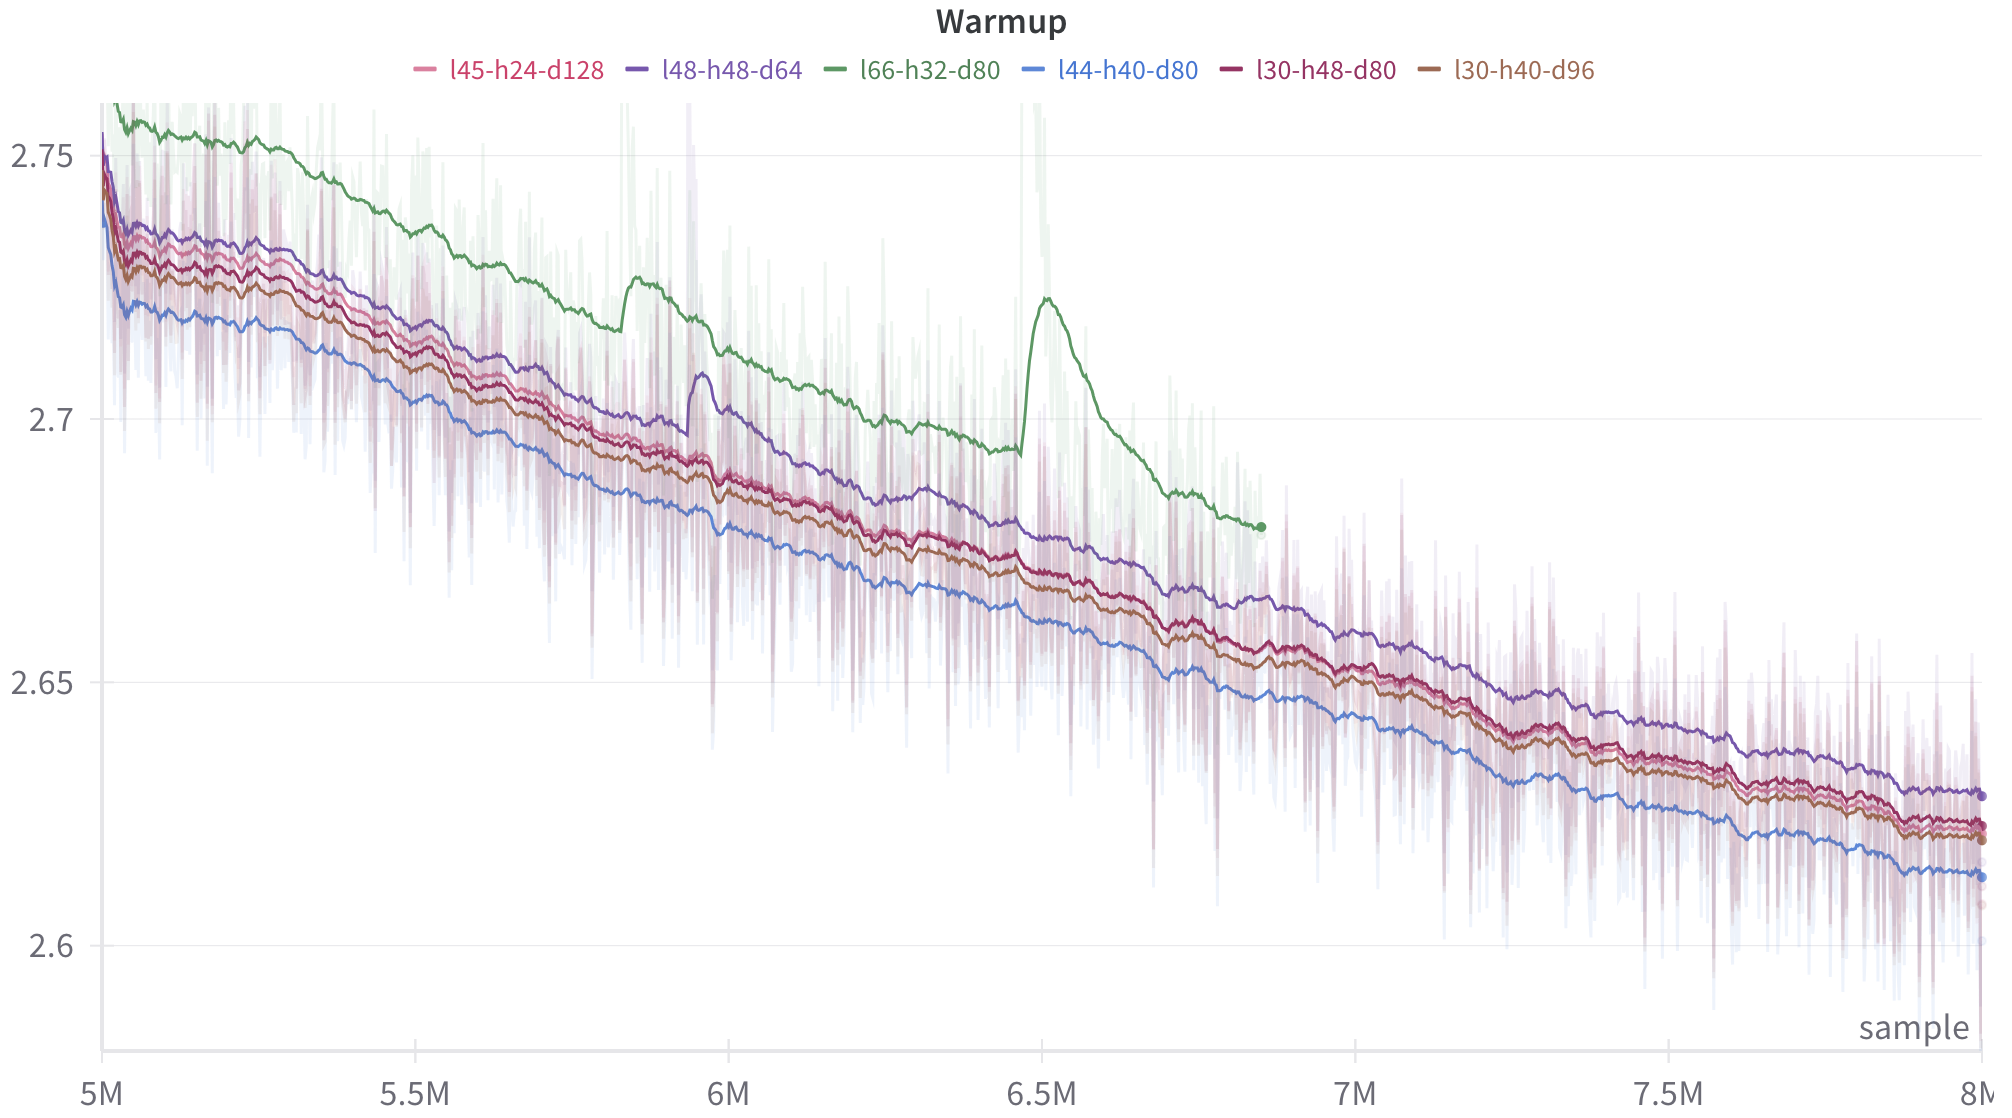
The image presents a line chart titled "Warmup," displaying the performance of several data series over a range of values on the x-axis, likely representing memory allocation or iterations. The y-axis represents a numerical value, potentially related to time or performance metrics. The chart shows a general downward trend for all series, indicating a decrease in the measured value as the x-axis value increases.
### Components/Axes
* **Title:** Warmup (centered at the top)
* **X-axis:** Labeled "sample" at the bottom-right. Scale ranges from approximately 5M to 8M. The axis is divided into segments with vertical grid lines at approximately 5.5M, 6M, 6.5M, 7M, and 7.5M.
* **Y-axis:** No explicit label, but the scale ranges from approximately 2.6 to 2.75. The axis is divided into segments with horizontal grid lines at 2.6, 2.65, 2.7, and 2.75.
* **Legend:** Located at the top-right of the chart. Contains the following data series labels and corresponding colors:
* 145-h24-d128 (Red)
* 148-h48-d64 (Green)
* 166-h32-d80 (Blue)
* 144-h40-d80 (Purple)
* 130-h48-d96 (Gray)
### Detailed Analysis
The chart displays five distinct lines, each representing a different configuration (as indicated by the legend). All lines exhibit a decreasing trend, but with varying degrees of fluctuation.
* **145-h24-d128 (Red):** Starts at approximately 2.74 at 5M, decreases to around 2.63 at 7M, and ends at approximately 2.61 at 8M. The line shows moderate fluctuations throughout the range.
* **148-h48-d64 (Green):** Starts at approximately 2.75 at 5M, decreases to around 2.64 at 7M, and ends at approximately 2.62 at 8M. This line exhibits the most significant fluctuations, with several noticeable peaks and valleys.
* **166-h32-d80 (Blue):** Starts at approximately 2.73 at 5M, decreases to around 2.63 at 7M, and ends at approximately 2.61 at 8M. This line shows relatively smooth descent with minor fluctuations.
* **144-h40-d80 (Purple):** Starts at approximately 2.73 at 5M, decreases to around 2.63 at 7M, and ends at approximately 2.61 at 8M. This line is similar to the blue line in its smooth descent.
* **130-h48-d96 (Gray):** Starts at approximately 2.72 at 5M, decreases to around 2.63 at 7M, and ends at approximately 2.61 at 8M. This line shows moderate fluctuations, similar to the red line.
All lines converge towards a value of approximately 2.61 at 8M.
### Key Observations
* All configurations show a decreasing trend, suggesting a "warmup" period where performance improves or stabilizes.
* The green line (148-h48-d64) exhibits the most variability, indicating potentially higher sensitivity to fluctuations during the warmup process.
* The blue and purple lines (166-h32-d80 and 144-h40-d80) show the most stable behavior.
* The lines converge at the end of the range, suggesting that all configurations reach a similar performance level after the warmup period.
### Interpretation
The chart likely represents a performance evaluation during a "warmup" phase of a system or algorithm. The x-axis represents the progression of the warmup process (e.g., number of iterations, memory allocated), and the y-axis represents a performance metric (e.g., execution time, memory usage). The decreasing trend indicates that the system's performance improves as it "warms up."
The different lines represent different configurations or settings. The variability in the green line suggests that this configuration is more sensitive to initial conditions or fluctuations during the warmup process. The convergence of the lines at the end of the range suggests that all configurations eventually reach a stable performance level.
The data suggests that a warmup period is necessary for optimal performance, and that the choice of configuration can influence the stability and speed of the warmup process. The "sample" label on the x-axis suggests that the data points are taken at discrete intervals during the warmup process. The lack of units on the y-axis makes it difficult to determine the exact meaning of the performance metric, but it is likely a measure of efficiency or speed.