\n
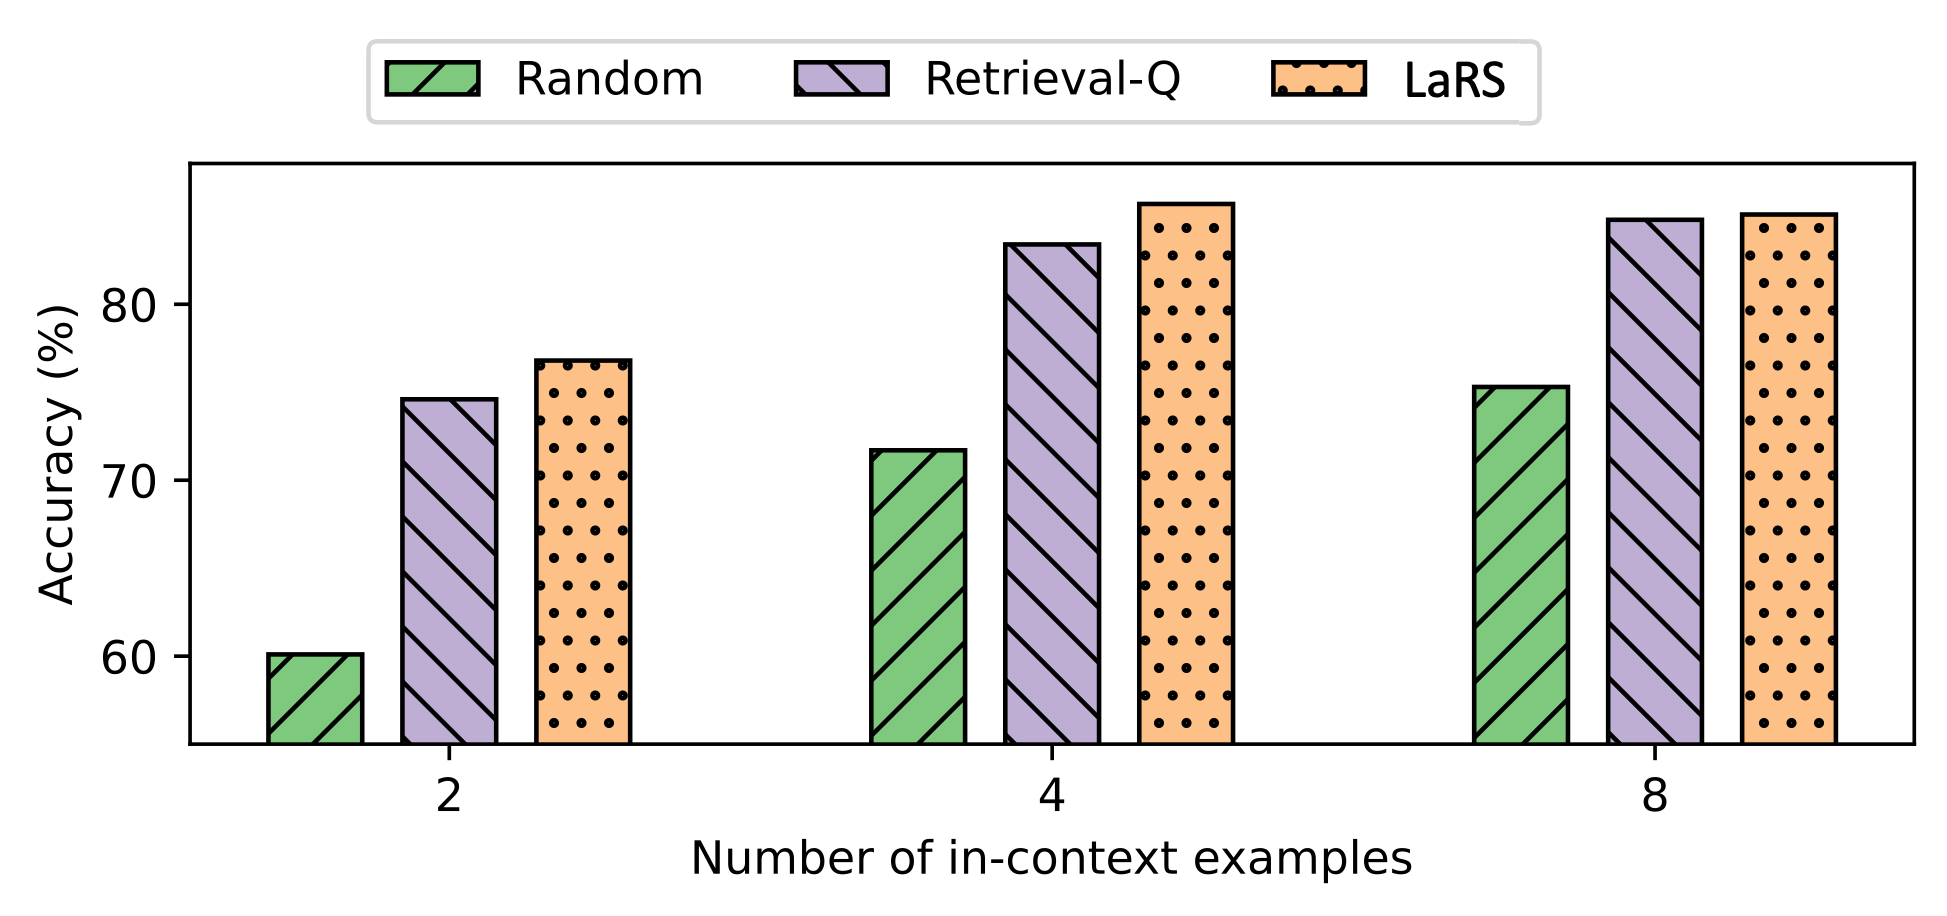
## Bar Chart: Accuracy vs. Number of In-Context Examples
### Overview
This bar chart compares the accuracy of three different methods – Random, Retrieval-Q, and LaRS – across varying numbers of in-context examples (2, 4, and 8). Accuracy is measured as a percentage. The chart uses a grouped bar format, with each method represented by a different color and pattern.
### Components/Axes
* **X-axis:** "Number of in-context examples" with markers at 2, 4, and 8.
* **Y-axis:** "Accuracy (%)" with a scale ranging from approximately 55% to 90%.
* **Legend:** Located in the top-center of the chart.
* **Random:** Represented by a green bar with a solid fill and a green border.
* **Retrieval-Q:** Represented by a purple bar with diagonal lines.
* **LaRS:** Represented by a brown bar with dots.
### Detailed Analysis
The chart consists of three groups of bars, one for each number of in-context examples (2, 4, and 8). Within each group, there are three bars representing the accuracy of Random, Retrieval-Q, and LaRS.
**Number of In-Context Examples = 2:**
* **Random:** Approximately 60% accuracy.
* **Retrieval-Q:** Approximately 75% accuracy.
* **LaRS:** Approximately 78% accuracy.
**Number of In-Context Examples = 4:**
* **Random:** Approximately 72% accuracy.
* **Retrieval-Q:** Approximately 85% accuracy.
* **LaRS:** Approximately 87% accuracy.
**Number of In-Context Examples = 8:**
* **Random:** Approximately 74% accuracy.
* **Retrieval-Q:** Approximately 85% accuracy.
* **LaRS:** Approximately 88% accuracy.
### Key Observations
* **Trend:** For all three methods, accuracy generally increases as the number of in-context examples increases.
* **Performance:** LaRS consistently achieves the highest accuracy across all numbers of in-context examples. Retrieval-Q performs better than Random.
* **Diminishing Returns:** The accuracy gains from increasing the number of in-context examples appear to diminish as the number increases. The difference in accuracy between 4 and 8 in-context examples is smaller than the difference between 2 and 4.
* **Random Baseline:** The Random method provides a baseline performance, and its accuracy is significantly lower than Retrieval-Q and LaRS.
### Interpretation
The data suggests that providing more in-context examples improves the accuracy of all three methods. However, the benefit of adding more examples decreases as the number of examples increases. LaRS appears to be the most effective method, consistently outperforming both Retrieval-Q and Random. This could indicate that LaRS is better at leveraging the information provided in the in-context examples. The Random method's low accuracy suggests that simply providing examples without a specific retrieval or reasoning mechanism is not sufficient for achieving high performance. The chart demonstrates the importance of both the quantity and quality of in-context examples in improving the performance of these methods. The consistent performance of Retrieval-Q and LaRS suggests that the retrieval or reasoning component is crucial for effectively utilizing the in-context information.