## Grouped Bar Chart: Accuracy vs. Number of In-Context Examples
### Overview
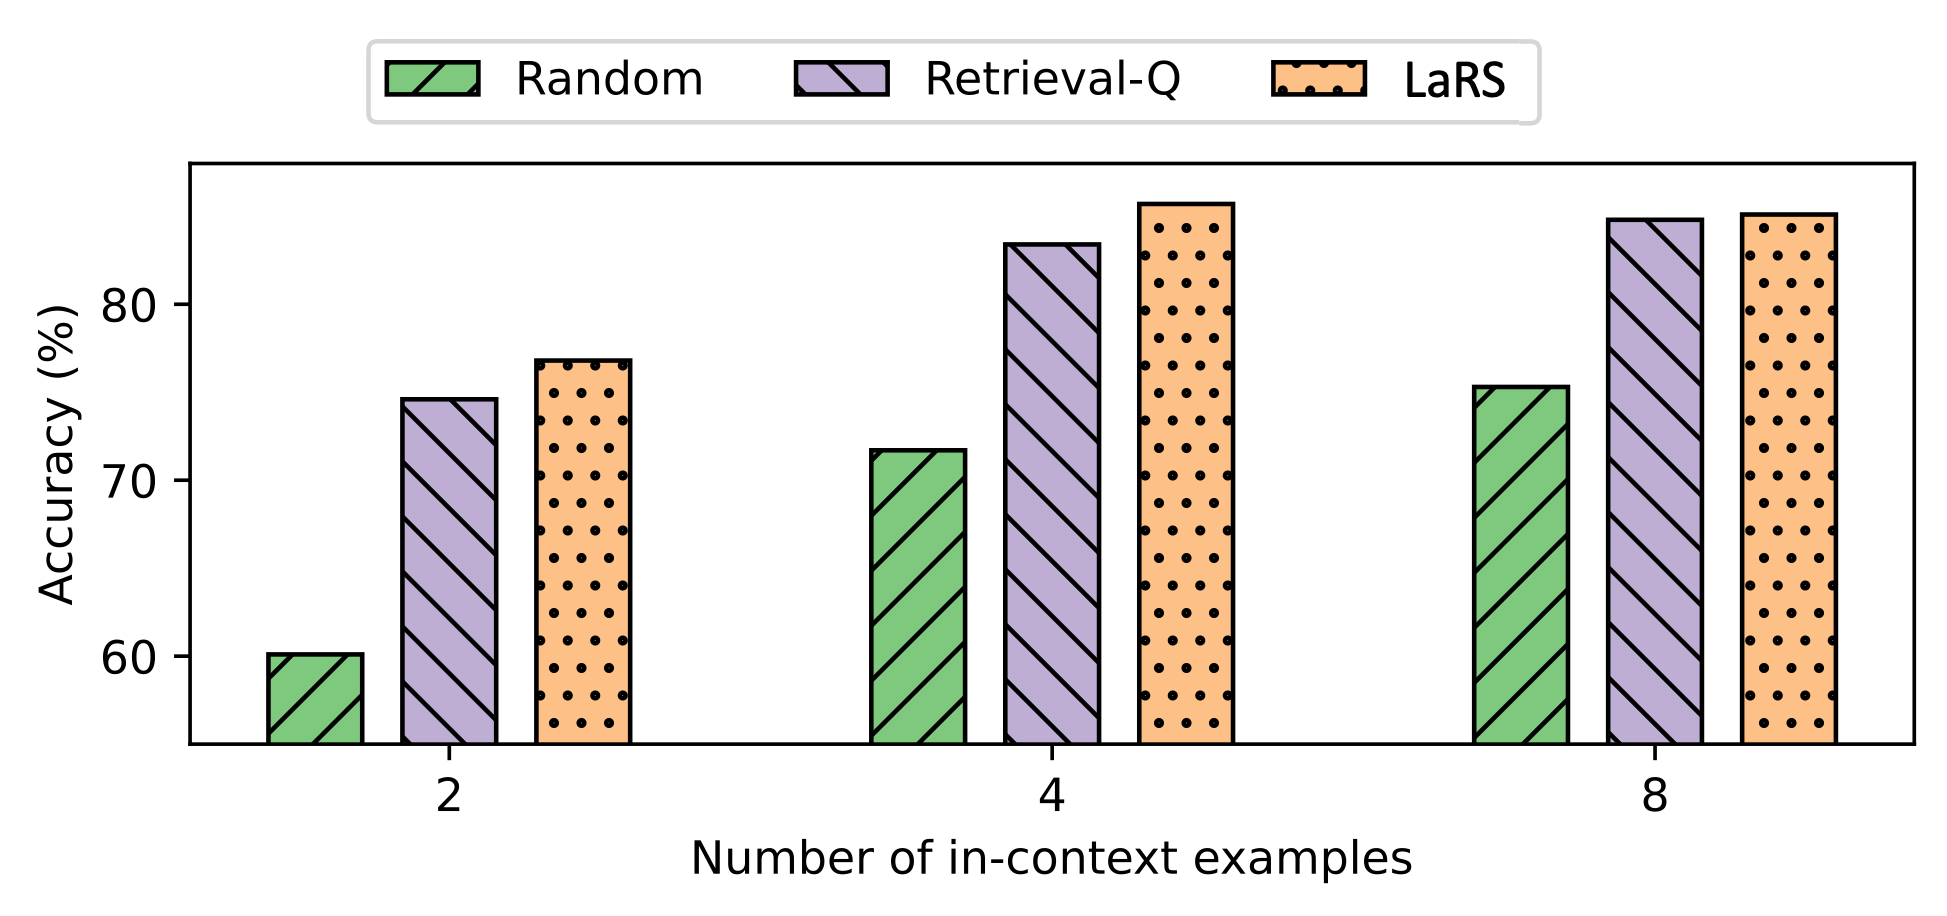
This is a grouped bar chart comparing the performance (accuracy) of three different methods—Random, Retrieval-Q, and LaRS—across three different settings for the number of in-context examples provided (2, 4, and 8). The chart visually demonstrates how accuracy changes for each method as the number of examples increases.
### Components/Axes
* **Chart Type:** Grouped Bar Chart.
* **X-Axis:** Labeled "Number of in-context examples". It has three categorical tick marks: `2`, `4`, and `8`.
* **Y-Axis:** Labeled "Accuracy (%)". The scale runs from approximately 55% to just above 85%, with major tick marks at 60, 70, and 80.
* **Legend:** Positioned at the top center of the chart area. It defines three data series:
* **Random:** Represented by a green bar with diagonal stripes (top-left to bottom-right).
* **Retrieval-Q:** Represented by a light purple bar with diagonal stripes (top-right to bottom-left).
* **LaRS:** Represented by an orange bar with a black dot pattern.
### Detailed Analysis
Data values are approximate, read from the visual alignment of bar tops with the y-axis.
**For 2 in-context examples:**
* **Random (Green, Striped):** Accuracy is approximately **60%**.
* **Retrieval-Q (Purple, Striped):** Accuracy is approximately **75%**.
* **LaRS (Orange, Dotted):** Accuracy is approximately **77%**.
**For 4 in-context examples:**
* **Random (Green, Striped):** Accuracy increases to approximately **72%**.
* **Retrieval-Q (Purple, Striped):** Accuracy increases to approximately **84%**.
* **LaRS (Orange, Dotted):** Accuracy increases to approximately **86%**.
**For 8 in-context examples:**
* **Random (Green, Striped):** Accuracy increases further to approximately **75%**.
* **Retrieval-Q (Purple, Striped):** Accuracy is approximately **85%**.
* **LaRS (Orange, Dotted):** Accuracy is approximately **86%**.
### Key Observations
1. **Consistent Hierarchy:** At every data point (2, 4, and 8 examples), the performance order is consistent: LaRS > Retrieval-Q > Random.
2. **Positive Trend:** All three methods show a positive trend; accuracy increases as the number of in-context examples increases from 2 to 4 to 8.
3. **Diminishing Returns:** The most significant performance jump for all methods occurs when moving from 2 to 4 examples. The improvement from 4 to 8 examples is much smaller, especially for LaRS and Retrieval-Q, suggesting a plateau effect.
4. **Performance Gap:** The gap between the best method (LaRS) and the baseline (Random) is substantial at all points, ranging from approximately 17 percentage points (at 2 examples) to 11 percentage points (at 8 examples).
5. **LaRS vs. Retrieval-Q:** LaRS consistently outperforms Retrieval-Q, but the margin is relatively small (approximately 2-3 percentage points).
### Interpretation
This chart presents a clear performance comparison for a machine learning or AI task, likely related to few-shot learning or in-context learning. The data suggests that:
* **Method Superiority:** The **LaRS** method is the most effective of the three, providing the highest accuracy regardless of the number of examples given.
* **Value of Examples:** Providing more in-context examples (moving from 2 to 4) yields a substantial benefit for all methods, indicating the model's ability to learn from provided examples.
* **Saturation Point:** The minimal gain from 4 to 8 examples implies that the models may be reaching a saturation point where additional examples provide limited new information for improving accuracy on this specific task. The task or model capacity might be the limiting factor.
* **Baseline Comparison:** The **Random** method serves as a baseline. Its lower performance confirms that the task requires non-trivial reasoning or pattern recognition that is not achieved by chance. The fact that its accuracy also improves with more examples suggests even a random selection might contain some useful signal or that the model's inference process benefits from a larger context window.
The chart effectively argues for the adoption of the LaRS method over Retrieval-Q and a random baseline, particularly when working with a small number of in-context examples (2-4).