## Bar Chart: Model Accuracy vs. Model Size
### Overview
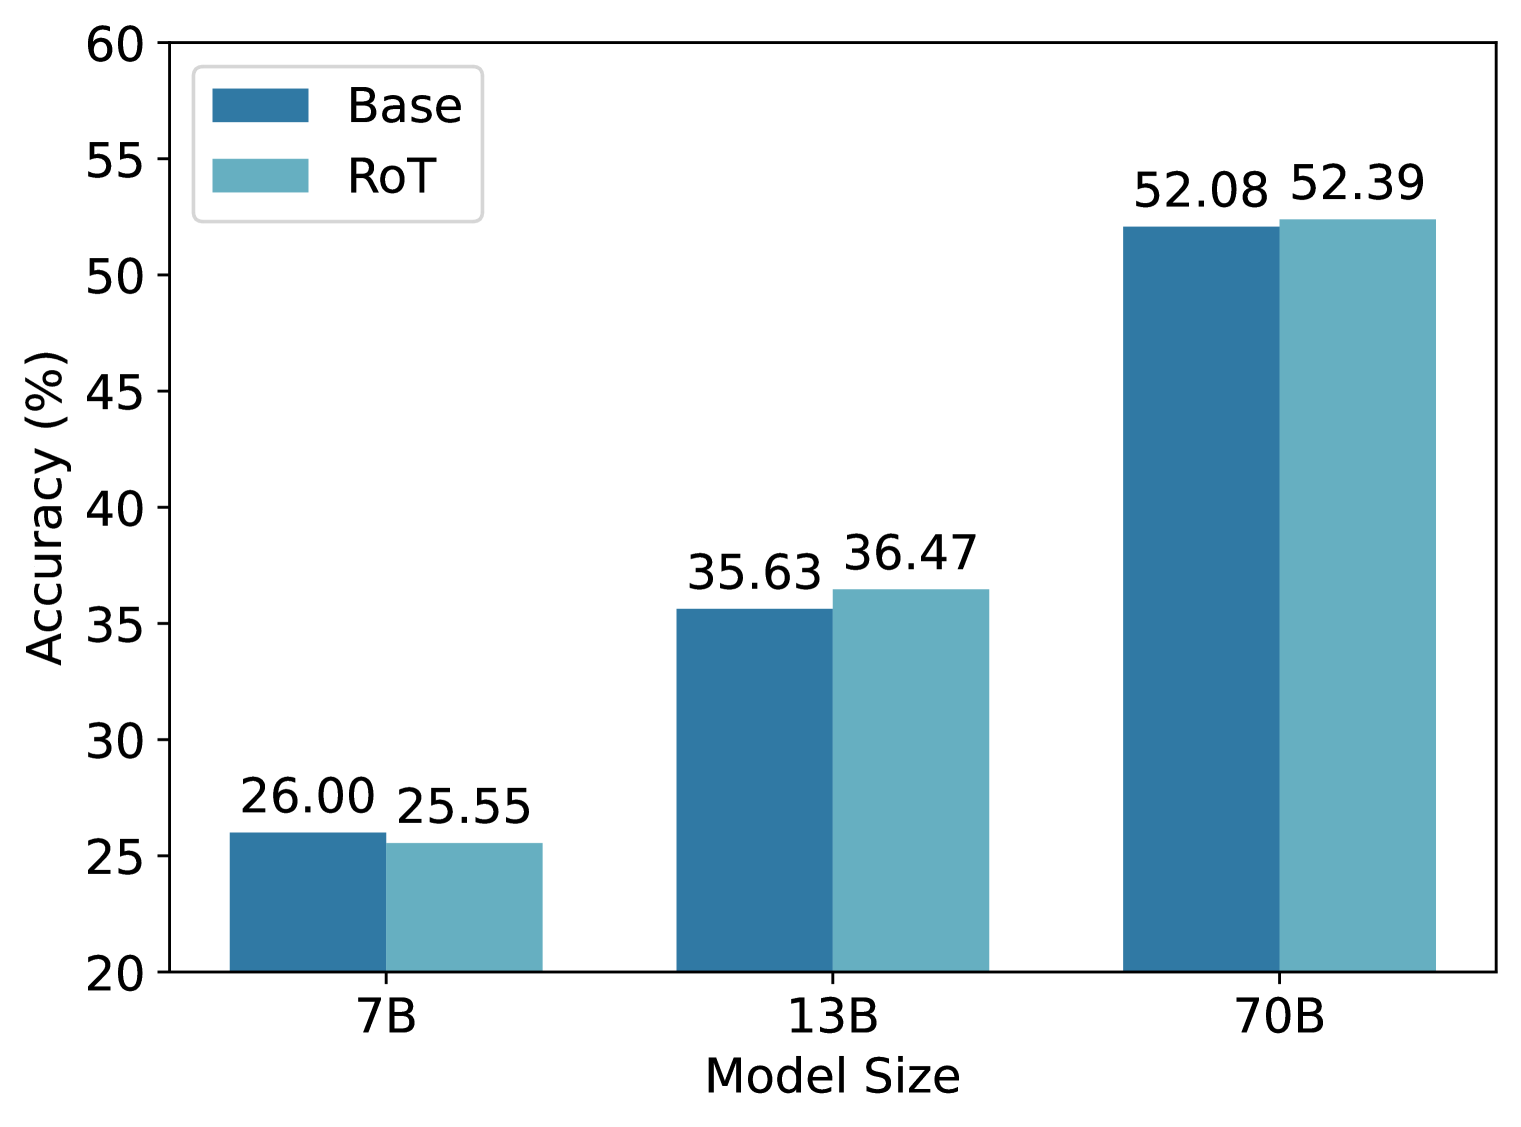
The image is a bar chart comparing the accuracy of two models, "Base" and "RoT," across three different model sizes: 7B, 13B, and 70B. The y-axis represents accuracy in percentage, ranging from 20% to 60%. The x-axis represents the model size.
### Components/Axes
* **X-axis:** Model Size (7B, 13B, 70B)
* **Y-axis:** Accuracy (%) with a scale from 20 to 60, incrementing by 5.
* **Legend:** Located in the top-left corner.
* "Base" is represented by a darker blue bar.
* "RoT" is represented by a lighter blue bar.
### Detailed Analysis
The chart presents accuracy values for each model size for both the "Base" and "RoT" models.
* **7B Model Size:**
* Base: 26.00%
* RoT: 25.55%
* **13B Model Size:**
* Base: 35.63%
* RoT: 36.47%
* **70B Model Size:**
* Base: 52.08%
* RoT: 52.39%
**Trend Verification:**
For both "Base" and "RoT" models, the accuracy increases as the model size increases from 7B to 70B.
### Key Observations
* The accuracy of both models increases significantly as the model size increases.
* The "RoT" model shows a slightly higher accuracy than the "Base" model for the 13B and 70B model sizes, but a slightly lower accuracy for the 7B model size.
* The most significant jump in accuracy occurs when moving from the 13B model size to the 70B model size for both models.
### Interpretation
The data suggests that increasing the model size has a positive impact on the accuracy of both the "Base" and "RoT" models. The "RoT" model appears to perform slightly better than the "Base" model at larger model sizes, indicating that the "RoT" modifications may be more effective as the model scales up. The substantial increase in accuracy from 13B to 70B suggests diminishing returns may not yet be a factor at these scales, and further scaling could potentially lead to even higher accuracy. The difference between the two models is minimal, suggesting that the "RoT" modification is not a major factor in determining accuracy.