## Bar Chart: Model Size vs. Accuracy Comparison
### Overview
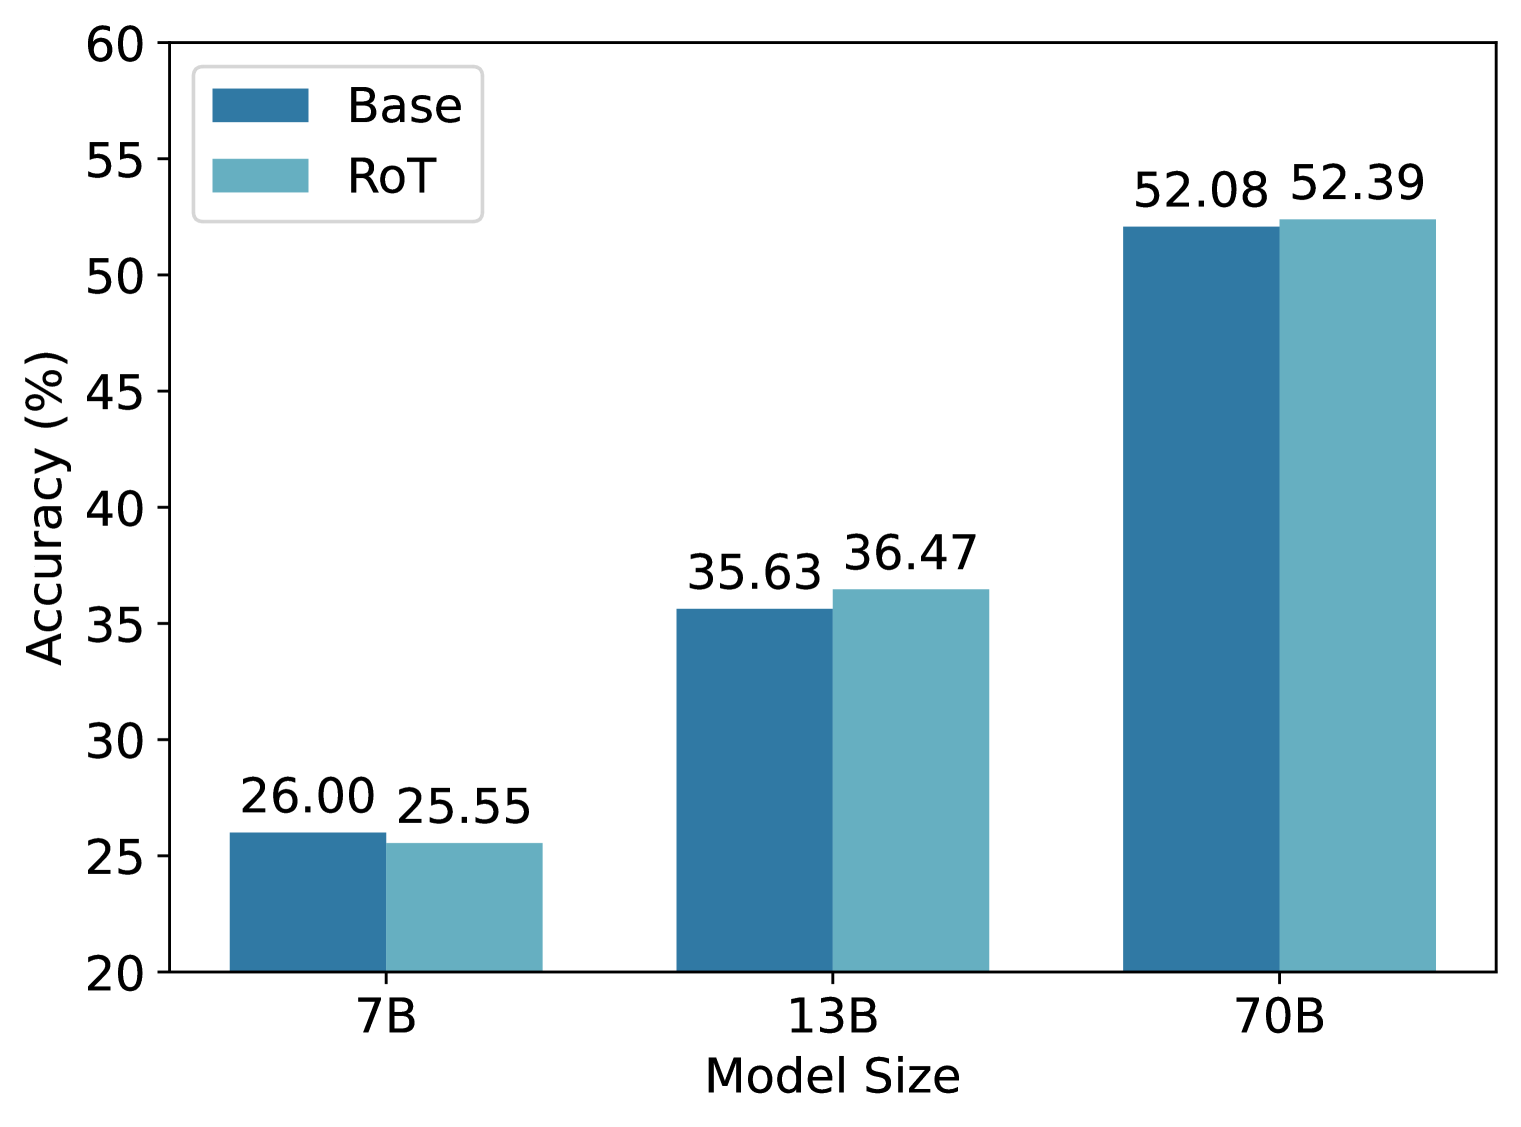
The chart compares the accuracy of two methods ("Base" and "RoT") across three model sizes (7B, 13B, 70B). Accuracy is measured in percentage, with values ranging from 20% to 60% on the y-axis. The x-axis categorizes models by size, and two colored bars represent each method per model size.
### Components/Axes
- **Y-Axis**: "Accuracy (%)" (20–60% in 5% increments).
- **X-Axis**: "Model Size" with categories: 7B, 13B, 70B.
- **Legend**:
- **Base**: Dark blue bars.
- **RoT**: Light blue bars.
- **Data Labels**: Numerical values atop each bar (e.g., "26.00" for Base at 7B).
### Detailed Analysis
- **7B Model**:
- Base: 26.00% (dark blue).
- RoT: 25.55% (light blue).
- **13B Model**:
- Base: 35.63% (dark blue).
- RoT: 36.47% (light blue).
- **70B Model**:
- Base: 52.08% (dark blue).
- RoT: 52.39% (light blue).
### Key Observations
1. **Upward Trend**: Both methods show increased accuracy with larger model sizes.
2. **RoT Superiority**: RoT consistently outperforms Base, though the margin narrows at 70B (0.31% difference vs. 0.55% at 13B).
3. **70B Dominance**: The largest model achieves the highest accuracy for both methods, with RoT slightly edging out Base.
### Interpretation
The data suggests that:
- **Model Size Matters**: Larger models (70B) significantly outperform smaller ones (7B), with accuracy nearly doubling for Base (26.00% → 52.08%) and RoT (25.55% → 52.39%).
- **RoT as an Enhancement**: RoT improves accuracy over Base across all sizes, but the relative gain diminishes at scale. This could indicate diminishing returns or inherent limitations in the RoT method.
- **Practical Implications**: While RoT is marginally better, the computational cost of larger models (70B) may outweigh minor accuracy gains, depending on use-case priorities.
### Spatial Grounding & Verification
- Legend colors match bar colors exactly (Base = dark blue, RoT = light blue).
- Data labels are spatially aligned with their respective bars, confirming accuracy values.
- Trends (upward slope for both series) align with numerical data, validating consistency.