## Chart: Performance Comparison of Different Models
### Overview
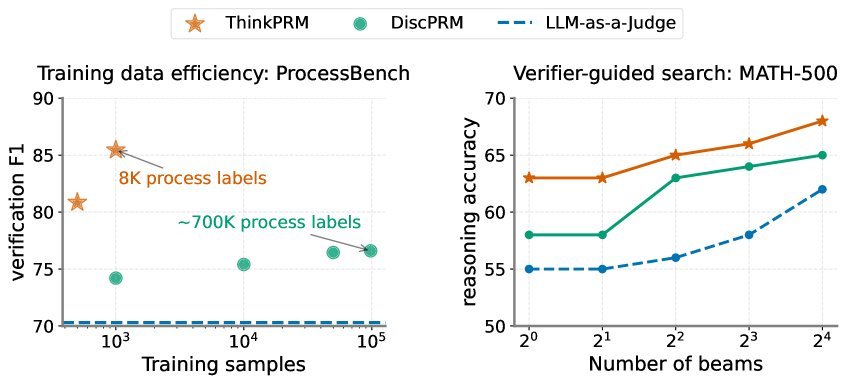
The image contains two scatter plots comparing the performance of different models: ThinkPRM, DiscPRM, and LLM-as-a-Judge. The left plot shows the training data efficiency on ProcessBench, while the right plot shows the verifier-guided search performance on MATH-500.
### Components/Axes
**Left Plot: Training data efficiency: ProcessBench**
* **Title:** Training data efficiency: ProcessBench
* **X-axis:** Training samples (Logarithmic scale)
* Axis markers: 10^3, 10^4, 10^5
* **Y-axis:** verification F1
* Axis markers: 70, 75, 80, 85, 90
* **Legend:** Located at the top of the image.
* ThinkPRM (Orange Star)
* DiscPRM (Teal Circle)
* LLM-as-a-Judge (Dashed Blue Line)
**Right Plot: Verifier-guided search: MATH-500**
* **Title:** Verifier-guided search: MATH-500
* **X-axis:** Number of beams (Logarithmic scale, base 2)
* Axis markers: 2^0, 2^1, 2^2, 2^3, 2^4
* **Y-axis:** reasoning accuracy
* Axis markers: 50, 55, 60, 65, 70
* **Legend:** Located at the top of the image.
* ThinkPRM (Orange Star)
* DiscPRM (Teal Circle)
* LLM-as-a-Judge (Dashed Blue Line)
### Detailed Analysis
**Left Plot: Training data efficiency: ProcessBench**
* **ThinkPRM (Orange Star):**
* Trend: Relatively stable, slightly increasing.
* Data points:
* At 10^3 Training samples, verification F1 is approximately 81.
* At 10^3 Training samples, verification F1 is approximately 85.5.
* **DiscPRM (Teal Circle):**
* Trend: Slightly increasing.
* Data points:
* At 10^3 Training samples, verification F1 is approximately 74.
* At 10^4 Training samples, verification F1 is approximately 75.5.
* At 10^5 Training samples, verification F1 is approximately 76.5.
* **LLM-as-a-Judge (Dashed Blue Line):**
* Trend: Flat.
* Data points:
* verification F1 is approximately 70 across all training samples.
**Annotations on Left Plot:**
* "8K process labels" points to the ThinkPRM data point at 10^3 training samples.
* "~700K process labels" points to the DiscPRM data point at 10^5 training samples.
**Right Plot: Verifier-guided search: MATH-500**
* **ThinkPRM (Orange Star):**
* Trend: Increasing.
* Data points:
* At 2^0 Number of beams, reasoning accuracy is approximately 63.
* At 2^1 Number of beams, reasoning accuracy is approximately 63.
* At 2^2 Number of beams, reasoning accuracy is approximately 65.
* At 2^3 Number of beams, reasoning accuracy is approximately 67.
* **DiscPRM (Teal Circle):**
* Trend: Increasing.
* Data points:
* At 2^0 Number of beams, reasoning accuracy is approximately 58.
* At 2^1 Number of beams, reasoning accuracy is approximately 58.
* At 2^2 Number of beams, reasoning accuracy is approximately 63.
* At 2^3 Number of beams, reasoning accuracy is approximately 64.
* At 2^4 Number of beams, reasoning accuracy is approximately 65.
* **LLM-as-a-Judge (Dashed Blue Line):**
* Trend: Increasing.
* Data points:
* At 2^0 Number of beams, reasoning accuracy is approximately 55.
* At 2^1 Number of beams, reasoning accuracy is approximately 55.
* At 2^2 Number of beams, reasoning accuracy is approximately 56.
* At 2^3 Number of beams, reasoning accuracy is approximately 58.
* At 2^4 Number of beams, reasoning accuracy is approximately 62.
### Key Observations
* In the left plot, ThinkPRM outperforms DiscPRM and LLM-as-a-Judge in terms of training data efficiency on ProcessBench. LLM-as-a-Judge has a flat performance regardless of the number of training samples.
* In the right plot, ThinkPRM consistently outperforms DiscPRM and LLM-as-a-Judge in terms of reasoning accuracy on MATH-500. All models show an increase in reasoning accuracy as the number of beams increases.
### Interpretation
The plots suggest that ThinkPRM is more efficient in utilizing training data for the ProcessBench task and achieves higher reasoning accuracy on the MATH-500 task compared to DiscPRM and LLM-as-a-Judge. The LLM-as-a-Judge model shows limited improvement with increased training data on ProcessBench, but its performance improves with a higher number of beams on MATH-500. The annotations on the left plot highlight the amount of process labels used for ThinkPRM and DiscPRM, suggesting that ThinkPRM achieves better performance with significantly fewer labels.