## Line Chart: Step Length vs Reasoning Tokens for Zero Shot Easy Blocksworld
### Overview
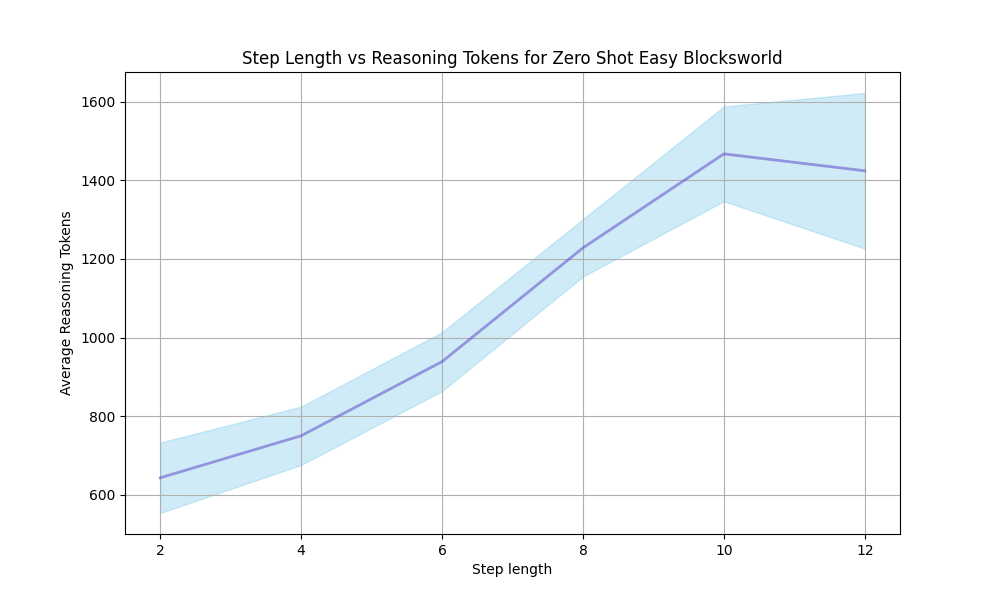
The image is a line chart that plots the relationship between "Step Length" and "Average Reasoning Tokens" for a "Zero Shot Easy Blocksworld" scenario. The chart displays a generally increasing trend, with a shaded area around the line indicating variability or confidence intervals.
### Components/Axes
* **Title:** Step Length vs Reasoning Tokens for Zero Shot Easy Blocksworld
* **X-axis:**
* Label: Step length
* Scale: 2, 4, 6, 8, 10, 12
* **Y-axis:**
* Label: Average Reasoning Tokens
* Scale: 600, 800, 1000, 1200, 1400, 1600
* **Data Series:**
* A single blue line represents the average reasoning tokens for each step length.
* A light blue shaded area surrounds the line, indicating the range of variability.
### Detailed Analysis
The blue line represents the average reasoning tokens. The light blue area around the line represents the confidence interval or standard deviation.
* **Step Length 2:** Average Reasoning Tokens ~650
* **Step Length 4:** Average Reasoning Tokens ~750
* **Step Length 6:** Average Reasoning Tokens ~950
* **Step Length 8:** Average Reasoning Tokens ~1250
* **Step Length 10:** Average Reasoning Tokens ~1450
* **Step Length 12:** Average Reasoning Tokens ~1425
**Trend Verification:** The blue line generally slopes upward from step length 2 to 10, indicating an increase in average reasoning tokens as step length increases. The line flattens out and slightly decreases between step length 10 and 12.
### Key Observations
* The average reasoning tokens generally increase with step length up to a step length of 10.
* The variability (shaded area) appears to increase with step length, suggesting less consistency in reasoning tokens for longer step lengths.
* The average reasoning tokens plateau or slightly decrease after a step length of 10.
### Interpretation
The chart suggests that, for the "Zero Shot Easy Blocksworld" scenario, longer step lengths generally require more reasoning tokens. However, this relationship plateaus or even slightly reverses after a step length of 10. This could indicate that there is a point of diminishing returns, where increasing the step length beyond a certain point does not significantly increase the reasoning required, or may even reduce it. The increasing variability with step length could suggest that the complexity of the task increases with step length, leading to a wider range of reasoning token usage.