\n
## Line Chart: Step Length vs Reasoning Tokens for Zero Shot Easy Blocksworld
### Overview
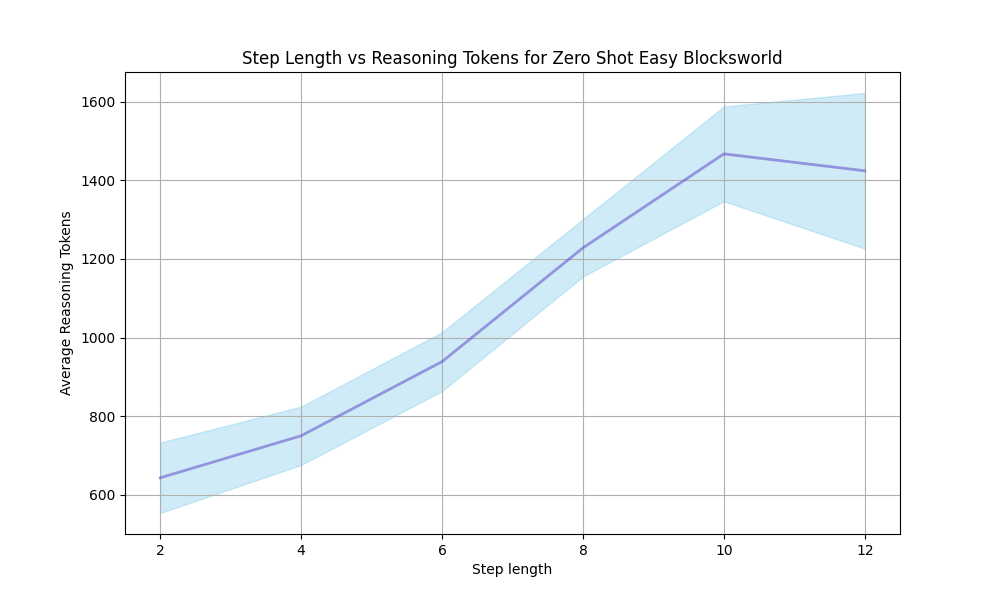
This image presents a line chart illustrating the relationship between "Step Length" and "Average Reasoning Tokens" in a "Zero Shot Easy Blocksworld" scenario. The chart displays a generally increasing trend, with some fluctuation, suggesting that as the step length increases, the average number of reasoning tokens also tends to increase. A shaded region around the line indicates the variance or confidence interval.
### Components/Axes
* **Title:** "Step Length vs Reasoning Tokens for Zero Shot Easy Blocksworld" - positioned at the top-center of the chart.
* **X-axis:** "Step length" - ranging from approximately 2 to 12, with tick marks at integer values.
* **Y-axis:** "Average Reasoning Tokens" - ranging from approximately 600 to 1600, with tick marks at intervals of 200.
* **Data Series:** A single blue line representing the relationship between step length and reasoning tokens. A light blue shaded region surrounds the line, representing the standard deviation or confidence interval.
### Detailed Analysis
The blue line representing the data series shows an overall upward trend. Let's break down the approximate values at specific step lengths:
* **Step Length = 2:** Average Reasoning Tokens ≈ 700
* **Step Length = 4:** Average Reasoning Tokens ≈ 800
* **Step Length = 6:** Average Reasoning Tokens ≈ 1000
* **Step Length = 8:** Average Reasoning Tokens ≈ 1300
* **Step Length = 10:** Average Reasoning Tokens ≈ 1500
* **Step Length = 12:** Average Reasoning Tokens ≈ 1400
The shaded region around the line indicates the variability in the data. The width of the shaded region appears to increase with step length, suggesting greater variance in the average reasoning tokens at higher step lengths. The shaded region at step length 12 is wider than at step length 2.
### Key Observations
* The relationship between step length and reasoning tokens is generally positive, but not strictly linear.
* There is a noticeable peak around step length 10, followed by a slight decrease at step length 12. This suggests that the increase in reasoning tokens may plateau or even decrease beyond a certain step length.
* The variance in reasoning tokens increases with step length.
### Interpretation
The chart suggests that as the complexity of the task (represented by step length) increases, the amount of reasoning required (measured in tokens) also increases. This is expected, as more steps likely require more complex planning and inference. The peak at step length 10 and subsequent decrease at step length 12 could indicate a point of diminishing returns, where further increasing the step length does not necessarily lead to a proportional increase in reasoning tokens. This could be due to the task becoming saturated with information or the model reaching a limit in its reasoning capacity. The increasing variance with step length suggests that the reasoning process becomes more unpredictable or diverse as the task becomes more complex. This data could be used to optimize the step length for a given task, balancing the need for sufficient reasoning with the cost of increased token usage. The "Zero Shot Easy Blocksworld" context implies that the model is performing this task without any prior training examples, making the observed relationship even more significant.