## Line Chart with Confidence Interval: Step Length vs Reasoning Tokens for Zero Shot Easy Blocksworld
### Overview
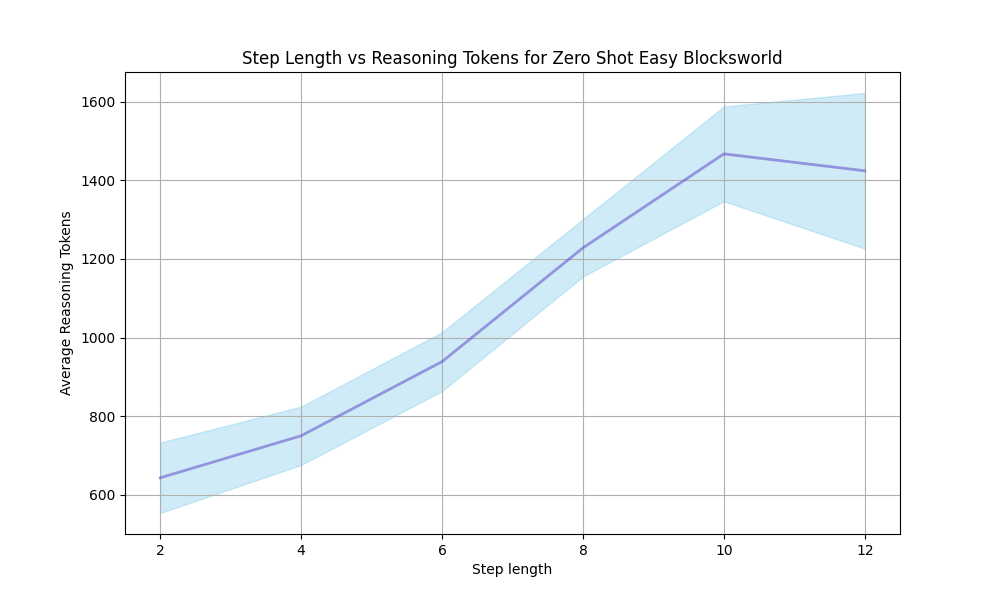
The image displays a line chart with a shaded confidence interval, illustrating the relationship between "Step length" and "Average Reasoning Tokens" in a "Zero Shot Easy Blocksworld" context. The chart shows a generally increasing trend in reasoning tokens as step length increases, with a peak around step length 10, followed by a slight decline. The shaded region indicates the variability or confidence interval around the mean trend line.
### Components/Axes
* **Chart Title:** "Step Length vs Reasoning Tokens for Zero Shot Easy Blocksworld" (Centered at the top).
* **X-Axis (Horizontal):**
* **Label:** "Step length" (Centered below the axis).
* **Scale:** Linear scale with major tick marks and labels at 2, 4, 6, 8, 10, and 12.
* **Y-Axis (Vertical):**
* **Label:** "Average Reasoning Tokens" (Centered to the left, rotated 90 degrees).
* **Scale:** Linear scale with major tick marks and labels at 600, 800, 1000, 1200, 1400, and 1600.
* **Data Series:**
* A single, solid purple line represents the mean or average value of "Reasoning Tokens" for each "Step length."
* A light blue, semi-transparent shaded area surrounds the purple line, representing the confidence interval, standard deviation, or range of the data.
* **Legend:** No explicit legend is present within the chart area. The single data series and its associated shaded region are self-explanatory from the axis labels and title.
* **Grid:** A light gray grid is present, with both horizontal and vertical lines aligned with the major tick marks.
### Detailed Analysis
**Data Points (Approximate Values from Visual Inspection):**
The following table reconstructs the approximate data points for the mean line (purple) and the bounds of the shaded region (light blue).
| Step Length | Average Reasoning Tokens (Mean - Purple Line) | Lower Bound (Shaded Area) | Upper Bound (Shaded Area) |
| :--- | :--- | :--- | :--- |
| 2 | ~640 | ~550 | ~730 |
| 4 | ~750 | ~680 | ~820 |
| 6 | ~940 | ~860 | ~1020 |
| 8 | ~1230 | ~1150 | ~1310 |
| 10 | ~1470 | ~1350 | ~1590 |
| 12 | ~1420 | ~1220 | ~1620 |
**Trend Verification:**
* **Visual Trend:** The purple line slopes upward from step length 2 to 10, indicating a positive correlation. The slope is gentle between steps 2-4, steepens between 4-8, and is steepest between 8-10. After step 10, the line slopes slightly downward to step 12.
* **Shaded Region Trend:** The width of the light blue shaded area (representing variability) appears to increase as the step length increases. It is narrowest at step length 2 and widest at step length 12.
### Key Observations
1. **Positive Correlation:** There is a clear positive relationship between step length and the average number of reasoning tokens required, up to a point.
2. **Peak and Plateau:** The average reasoning tokens peak at a step length of 10 (~1470 tokens) before showing a slight decrease at step length 12 (~1420 tokens). This suggests a potential plateau or optimal point in the relationship.
3. **Increasing Variability:** The confidence interval (shaded area) widens significantly as step length increases. This indicates that the model's reasoning token usage becomes less consistent or predictable for longer step lengths.
4. **Non-Linear Growth:** The increase in average tokens is not linear. The rate of increase accelerates between step lengths 4 and 10.
### Interpretation
The data suggests that in the "Zero Shot Easy Blocksworld" task, planning or reasoning over longer sequences of steps (higher step length) generally requires a greater computational effort, measured in reasoning tokens. This aligns with the intuitive understanding that more complex plans are harder to formulate.
The peak at step length 10 followed by a slight decline is a notable anomaly. It could indicate several possibilities:
* A **ceiling effect** in the model's reasoning capacity for this specific task difficulty.
* That step lengths beyond 10 may involve more repetitive or predictable patterns, slightly reducing the marginal reasoning cost.
* A potential artifact of the specific dataset or evaluation method used.
The most critical observation is the **increasing variance** (widening shaded area). This implies that while the *average* cost rises, the *reliability* of the reasoning process decreases for longer steps. Some instances at high step lengths may require vastly more tokens than others, making performance less stable. This is a crucial insight for understanding the model's limitations and scaling behavior. The chart effectively communicates not just the central tendency but also the growing uncertainty in the model's performance as task complexity (step length) increases.