## Chart: Performance vs. Arithmetic Intensity
### Overview
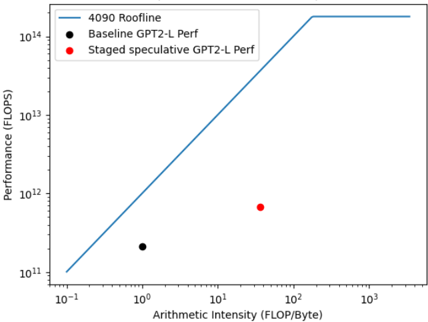
The image is a chart plotting performance (in FLOPS) against arithmetic intensity (in FLOP/Byte). It shows a "4090 Roofline" as a blue line, along with performance data points for "Baseline GPT2-L Perf" (black dot) and "Staged speculative GPT2-L Perf" (red dot). The axes are logarithmically scaled.
### Components/Axes
* **X-axis:** Arithmetic Intensity (FLOP/Byte), logarithmic scale with markers at 10<sup>-1</sup>, 10<sup>0</sup>, 10<sup>1</sup>, 10<sup>2</sup>, and 10<sup>3</sup>.
* **Y-axis:** Performance (FLOPS), logarithmic scale with markers at 10<sup>11</sup>, 10<sup>12</sup>, 10<sup>13</sup>, and 10<sup>14</sup>.
* **Legend:** Located in the top-right corner of the chart.
* Blue line: 4090 Roofline
* Black dot: Baseline GPT2-L Perf
* Red dot: Staged speculative GPT2-L Perf
### Detailed Analysis
* **4090 Roofline (Blue Line):**
* The line starts at approximately (10<sup>-1</sup>, 10<sup>11</sup>) and slopes upward until approximately (10<sup>2</sup>, 10<sup>14</sup>).
* After (10<sup>2</sup>, 10<sup>14</sup>), the line becomes horizontal, indicating a performance cap.
* **Baseline GPT2-L Perf (Black Dot):**
* Located at approximately (10<sup>0</sup>, 2 * 10<sup>11</sup>).
* **Staged speculative GPT2-L Perf (Red Dot):**
* Located at approximately (3 * 10<sup>1</sup>, 8 * 10<sup>11</sup>).
### Key Observations
* The 4090 Roofline shows a linear increase in performance with arithmetic intensity up to a certain point, after which performance plateaus.
* The Baseline GPT2-L Perf has a low arithmetic intensity and relatively low performance.
* The Staged speculative GPT2-L Perf has a higher arithmetic intensity and higher performance than the baseline.
### Interpretation
The chart illustrates the performance characteristics of GPT2-L under different configurations relative to the theoretical performance limit of a 4090 GPU (the "roofline"). The baseline performance is significantly below the roofline, suggesting potential for optimization. The staged speculative performance improves both arithmetic intensity and performance, moving closer to the roofline. The roofline itself demonstrates the hardware's performance cap, showing that increasing arithmetic intensity beyond a certain point does not yield further performance gains. The data suggests that the "Staged speculative" approach is more efficient in utilizing the hardware's capabilities compared to the baseline.