\n
## Chart: Performance vs. Arithmetic Intensity
### Overview
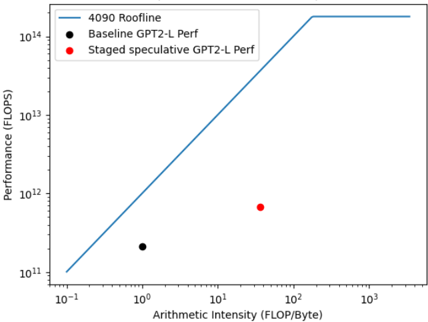
The image presents a chart illustrating the performance of different GPT2-L configurations against a theoretical performance limit (Roofline). The chart plots Performance (in FLOPS) against Arithmetic Intensity (in FLOP/Byte) on a logarithmic scale for both axes. There are three data series represented: a theoretical "4090 Roofline", "Baseline GPT2-L Perf", and "Staged speculative GPT2-L Perf".
### Components/Axes
* **X-axis:** Arithmetic Intensity (FLOP/Byte), ranging from 10<sup>-1</sup> to 10<sup>3</sup> on a logarithmic scale.
* **Y-axis:** Performance (FLOPS), ranging from 10<sup>11</sup> to 10<sup>14</sup> on a logarithmic scale.
* **Data Series:**
* "4090 Roofline" - Represented by a solid blue line.
* "Baseline GPT2-L Perf" - Represented by black circular markers.
* "Staged speculative GPT2-L Perf" - Represented by red circular markers.
* **Legend:** Located at the top-left corner of the chart, clearly labeling each data series with its corresponding color.
### Detailed Analysis
* **4090 Roofline:** The blue line representing the 4090 Roofline starts at approximately (10<sup>-1</sup>, 10<sup>11</sup>) and increases linearly until approximately (10<sup>2</sup>, 10<sup>13</sup>). Beyond this point, the line plateaus, remaining roughly constant at approximately 10<sup>13.5</sup> FLOPS. This indicates the theoretical maximum performance achievable by the 4090 hardware.
* **Baseline GPT2-L Perf:** The black circular marker representing the Baseline GPT2-L performance is located at approximately (1, 1.7 x 10<sup>12</sup> FLOPS).
* **Staged speculative GPT2-L Perf:** The red circular marker representing the Staged speculative GPT2-L performance is located at approximately (100, 9 x 10<sup>12</sup> FLOPS).
### Key Observations
* The Baseline GPT2-L performance is significantly below the 4090 Roofline, suggesting there is room for optimization.
* The Staged speculative GPT2-L performance is closer to the Roofline than the Baseline, indicating an improvement in performance through speculation.
* Both GPT2-L configurations exhibit relatively low arithmetic intensity compared to the peak performance region of the 4090 Roofline.
* The Roofline demonstrates a clear performance limit based on arithmetic intensity.
### Interpretation
The chart demonstrates the performance characteristics of GPT2-L models on a 4090 GPU, comparing a baseline implementation to a speculative version. The Roofline model provides a theoretical upper bound on performance, dictated by the hardware's capabilities. The significant gap between the baseline GPT2-L performance and the Roofline suggests that the baseline implementation is not fully utilizing the available hardware resources. The staged speculative version shows improvement, bringing it closer to the Roofline, but still leaves room for further optimization. The low arithmetic intensity of both configurations suggests that the models are memory-bound rather than compute-bound, meaning their performance is limited by the rate at which data can be moved to and from memory rather than the speed of the processor. This implies that optimizing memory access patterns could yield substantial performance gains. The plateau in the Roofline indicates that beyond a certain arithmetic intensity, further increases in computation will not result in increased performance due to memory bandwidth limitations.