TECHNICAL ASSET FINGERPRINT
b42a25d729d2f04a09329a50
Click to view fullscreen
Press ESC or click to close
FOUND IN PAPERS
EXPERT: healer-alpha-free VERSION 1
RUNTIME: free/openrouter/healer-alpha
INTEL_VERIFIED
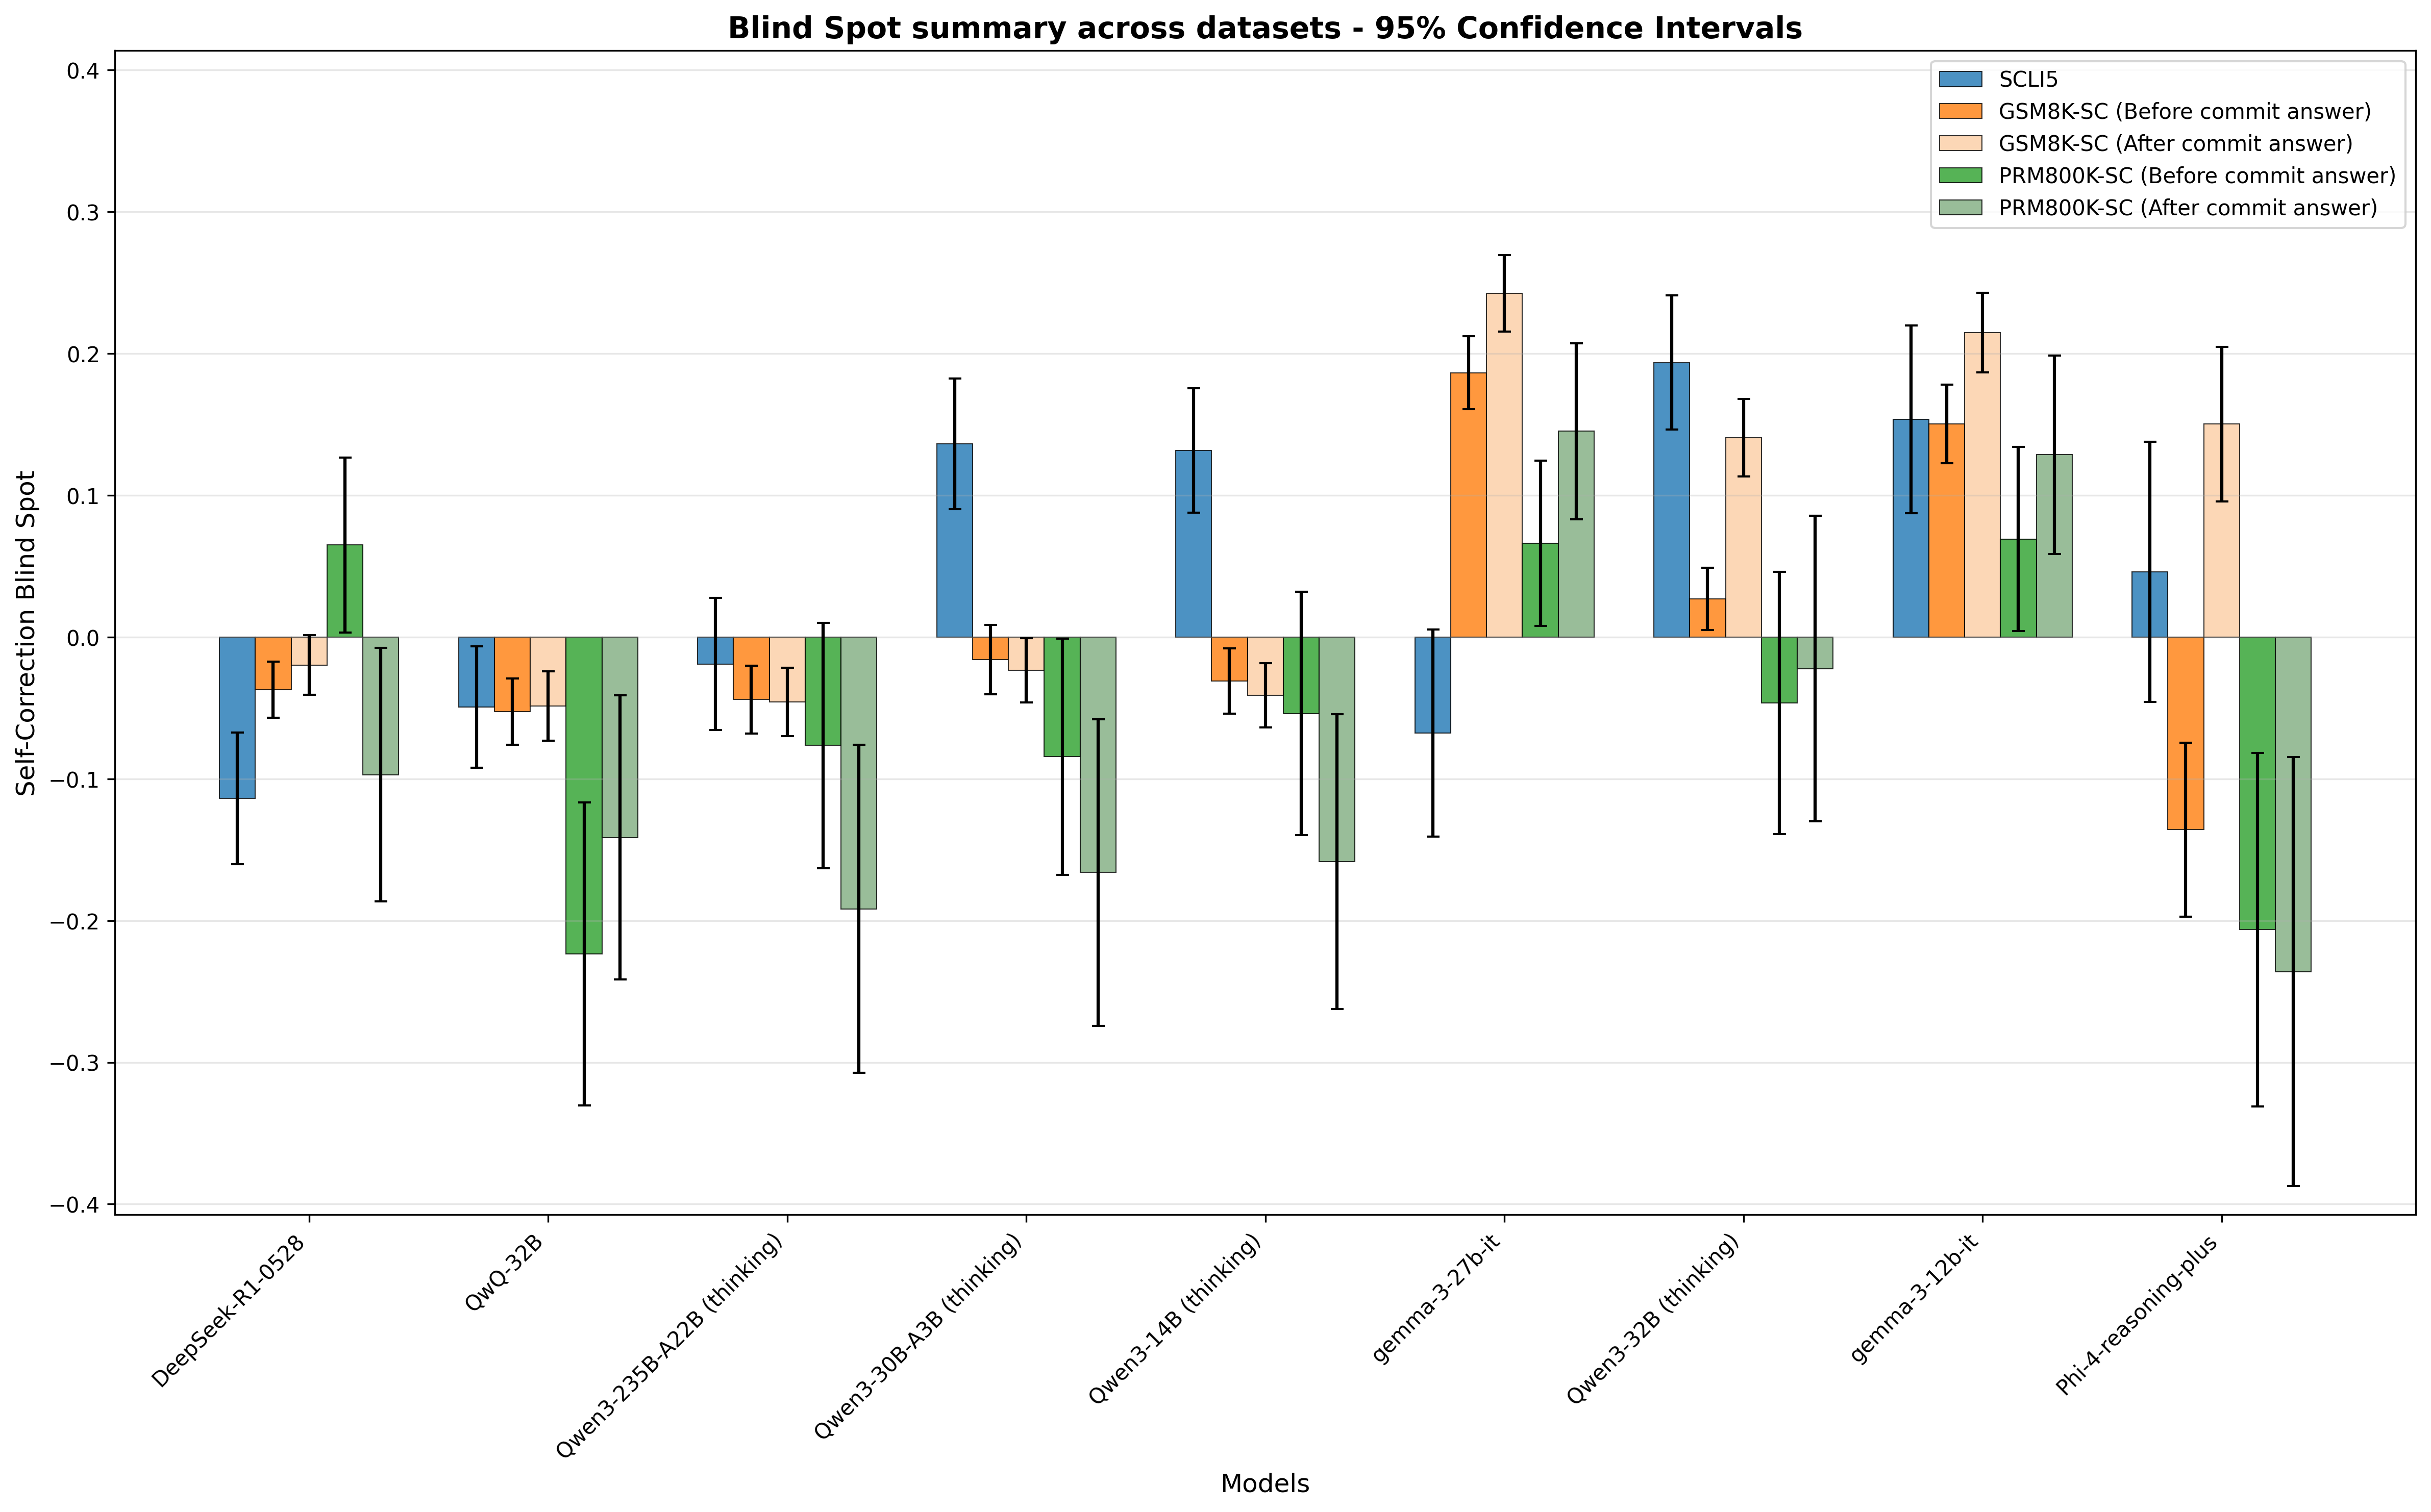
## Grouped Bar Chart with 95% Confidence Intervals: Blind Spot Summary Across Datasets
### Overview
This is a grouped bar chart with vertical error bars (representing 95% confidence intervals) that quantifies the "Self-Correction Blind Spot" metric for 9 distinct large language models, evaluated across 5 dataset variants. The metric measures how self-correction (after committing to an initial answer) impacts model performance: positive values indicate self-correction worsens performance (a "blind spot"), while negative values indicate self-correction improves performance.
### Components/Axes
- **Title**: "Blind Spot summary across datasets - 95% Confidence Intervals" (top-center of the chart)
- **Y-axis**: Labeled *Self-Correction Blind Spot*, with a linear scale ranging from -0.4 to 0.4, in increments of 0.1.
- **X-axis**: Labeled *Models*, listing 9 models (left to right):
1. DeepSeek-R1-0528
2. QwQ-32B
3. Qwen3-235B-A22B (thinking)
4. Qwen3-30B-A3B (thinking)
5. Qwen3-14B (thinking)
6. gemma-3-27b-it
7. Qwen3-32B (thinking)
8. gemma-3-12b-it
9. Phi-4-reasoning-plus
- **Legend (top-right)**: 5 dataset variants, each with a unique color:
1. SCLI5 (dark blue)
2. GSM8K-SC (Before commit answer) (orange)
3. GSM8K-SC (After commit answer) (light beige)
4. PRM800K-SC (Before commit answer) (dark green)
5. PRM800K-SC (After commit answer) (light green)
- **Error Bars**: Vertical bars extending above/below each data bar, representing the 95% confidence interval for each measurement.
### Detailed Analysis
Below are approximate values (with uncertainty ranges from error bars) for each model-dataset pair:
1. **DeepSeek-R1-0528**:
- SCLI5: ~-0.12 (range: -0.18 to -0.06)
- GSM8K-SC (Before): ~-0.04 (range: -0.07 to -0.01)
- GSM8K-SC (After): ~-0.02 (range: -0.05 to 0.01)
- PRM800K-SC (Before): ~0.07 (range: 0.01 to 0.13)
- PRM800K-SC (After): ~-0.10 (range: -0.19 to -0.01)
2. **QwQ-32B**:
- SCLI5: ~-0.05 (range: -0.09 to -0.01)
- GSM8K-SC (Before): ~-0.05 (range: -0.08 to -0.02)
- GSM8K-SC (After): ~-0.05 (range: -0.08 to -0.02)
- PRM800K-SC (Before): ~-0.22 (range: -0.33 to -0.11)
- PRM800K-SC (After): ~-0.14 (range: -0.24 to -0.04)
3. **Qwen3-235B-A22B (thinking)**:
- SCLI5: ~-0.01 (range: -0.07 to 0.05)
- GSM8K-SC (Before): ~-0.04 (range: -0.07 to -0.01)
- GSM8K-SC (After): ~-0.04 (range: -0.07 to -0.01)
- PRM800K-SC (Before): ~-0.07 (range: -0.16 to 0.02)
- PRM800K-SC (After): ~-0.19 (range: -0.30 to -0.08)
4. **Qwen3-30B-A3B (thinking)**:
- SCLI5: ~0.14 (range: 0.09 to 0.19)
- GSM8K-SC (Before): ~-0.01 (range: -0.04 to 0.02)
- GSM8K-SC (After): ~-0.02 (range: -0.05 to 0.01)
- PRM800K-SC (Before): ~-0.08 (range: -0.17 to 0.01)
- PRM800K-SC (After): ~-0.16 (range: -0.27 to -0.05)
5. **Qwen3-14B (thinking)**:
- SCLI5: ~0.13 (range: 0.09 to 0.17)
- GSM8K-SC (Before): ~-0.02 (range: -0.05 to 0.01)
- GSM8K-SC (After): ~-0.03 (range: -0.06 to 0.00)
- PRM800K-SC (Before): ~-0.05 (range: -0.14 to 0.04)
- PRM800K-SC (After): ~-0.16 (range: -0.26 to -0.06)
6. **gemma-3-27b-it**:
- SCLI5: ~-0.07 (range: -0.14 to 0.00)
- GSM8K-SC (Before): ~0.19 (range: 0.16 to 0.22)
- GSM8K-SC (After): ~0.24 (range: 0.21 to 0.27)
- PRM800K-SC (Before): ~0.07 (range: 0.01 to 0.13)
- PRM800K-SC (After): ~0.15 (range: 0.08 to 0.22)
7. **Qwen3-32B (thinking)**:
- SCLI5: ~0.19 (range: 0.14 to 0.24)
- GSM8K-SC (Before): ~0.03 (range: 0.00 to 0.06)
- GSM8K-SC (After): ~0.14 (range: 0.11 to 0.17)
- PRM800K-SC (Before): ~-0.04 (range: -0.14 to 0.06)
- PRM800K-SC (After): ~-0.02 (range: -0.13 to 0.09)
8. **gemma-3-12b-it**:
- SCLI5: ~0.15 (range: 0.09 to 0.21)
- GSM8K-SC (Before): ~0.15 (range: 0.12 to 0.18)
- GSM8K-SC (After): ~0.21 (range: 0.18 to 0.24)
- PRM800K-SC (Before): ~0.07 (range: 0.01 to 0.13)
- PRM800K-SC (After): ~0.13 (range: 0.06 to 0.20)
9. **Phi-4-reasoning-plus**:
- SCLI5: ~0.05 (range: -0.05 to 0.15)
- GSM8K-SC (Before): ~-0.14 (range: -0.20 to -0.08)
- GSM8K-SC (After): ~0.15 (range: 0.10 to 0.20)
- PRM800K-SC (Before): ~-0.20 (range: -0.33 to -0.07)
- PRM800K-SC (After): ~-0.23 (range: -0.39 to -0.07)
### Key Observations
1. **Dataset-specific trends**:
- SCLI5: Most models have positive blind spots, except DeepSeek-R1-0528, QwQ-32B, Qwen3-235B-A22B (thinking), and gemma-3-27b-it. The highest positive blind spot is Qwen3-32B (thinking) (~0.19), lowest is DeepSeek-R1-0528 (~-0.12).
- GSM8K-SC (Before vs After): For most models, the "After commit answer" blind spot is more positive (worse performance) than "Before", with the largest increase in gemma-3-27b-it (from ~0.19 to ~0.24).
- PRM800K-SC (Before vs After): For most models, "After commit answer" blind spots are more negative (better performance) than "Before", except gemma-3-27b-it and gemma-3-12b-it.
2. **Model-specific trends**:
- gemma-3-27b-it and gemma-3-12b-it have consistently positive blind spots across all datasets, with the highest values in GSM8K-SC (After).
- Phi-4-reasoning-plus has the most extreme negative blind spots in PRM800K-SC (Before/After), but a positive blind spot in GSM8K-SC (After).
3. **Statistical uncertainty**: For many model-dataset pairs, error bars overlap between "Before" and "After" variants, indicating that observed differences may not be statistically significant.
### Interpretation
The "Self-Correction Blind Spot" metric reveals how self-correction (post-initial answer commitment) impacts model performance:
- Positive values indicate self-correction worsens performance, suggesting the model is overconfident in initial answers or has an ineffective self-correction mechanism. The gemma models show this pattern consistently, implying their self-correction does not improve (and may harm) performance across these datasets.
- Negative values indicate self-correction improves performance, meaning the model can refine its initial answer effectively. Phi-4-reasoning-plus shows this strongly in PRM800K-SC, suggesting its self-correction works well for that dataset's reasoning tasks.
- The difference between "Before" and "After" variants shows dataset structure impacts self-correction effectiveness: GSM8K-SC variants lead to worse self-correction performance for most models, while PRM800K-SC variants lead to better performance. This suggests the type of reasoning required (e.g., math vs. general reasoning) and answer commitment protocols shape how well models can correct their initial answers.
- Overlapping error bars caution against overinterpreting small differences; larger sample sizes would be needed to confirm statistically significant trends.
DECODING INTELLIGENCE...