## Flow Diagram: Acute Coronary Syndrome (ACS) Diagnosis
### Overview
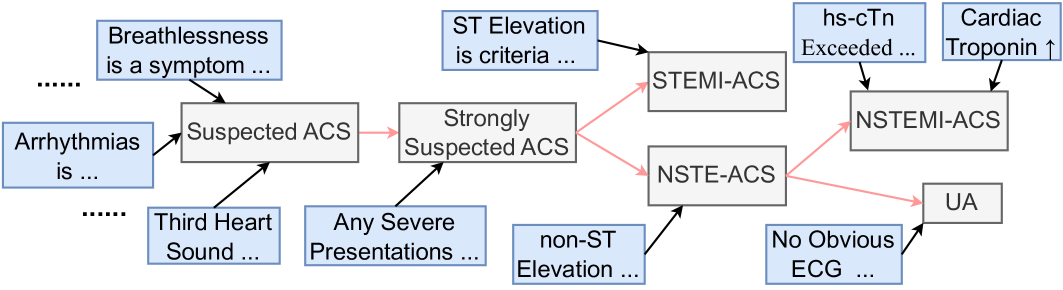
The image is a flow diagram illustrating the diagnostic process for Acute Coronary Syndrome (ACS). It shows the progression from initial symptoms and findings to specific diagnoses like STEMI-ACS, NSTEMI-ACS, NSTE-ACS, and UA. The diagram uses boxes to represent conditions or diagnostic categories, and arrows to indicate the flow of the diagnostic process.
### Components/Axes
* **Boxes:** Represent different stages or diagnoses in the ACS diagnostic pathway. Boxes are either light blue or light gray.
* **Arrows:** Indicate the flow of the diagnostic process. Black arrows indicate a direct progression, while pink arrows indicate a possible progression.
* **Text Labels:** Describe the conditions, symptoms, or diagnostic criteria associated with each box.
### Detailed Analysis or ### Content Details
1. **Initial Symptoms/Findings (Top-Left):**
* "Breathlessness is a symptom..." (light blue box, top-left)
* "Arrhythmias is..." (light blue box, left)
* "Third Heart Sound..." (light blue box, bottom-left)
* "Any Severe Presentations..." (light blue box, bottom)
2. **Initial Assessment:**
* "Suspected ACS" (light gray box, center-left). This box receives arrows from "Breathlessness is a symptom...", "Arrhythmias is...", and "Third Heart Sound...".
3. **Further Assessment:**
* "Strongly Suspected ACS" (light gray box, center). This box receives an arrow from "Suspected ACS" (pink arrow) and "Any Severe Presentations...".
4. **Diagnostic Criteria (Top):**
* "ST Elevation is criteria..." (light blue box, top)
* "hs-cTn Exceeded..." (light blue box, top-right)
* "Cardiac Troponin ↑" (light blue box, top-right)
* "non-ST Elevation..." (light blue box, bottom)
* "No Obvious ECG..." (light blue box, bottom-right)
5. **Specific Diagnoses:**
* "STEMI-ACS" (light gray box, top-center). This box receives arrows from "ST Elevation is criteria..." and "Strongly Suspected ACS" (pink arrow).
* "NSTE-ACS" (light gray box, center). This box receives arrows from "non-ST Elevation..." and "Strongly Suspected ACS" (pink arrow).
* "NSTEMI-ACS" (light gray box, right). This box receives arrows from "hs-cTn Exceeded..." and "Cardiac Troponin ↑".
* "UA" (light gray box, bottom-right). This box receives arrows from "NSTE-ACS" (pink arrow) and "No Obvious ECG...".
### Key Observations
* The diagram illustrates a step-by-step approach to diagnosing ACS, starting with initial symptoms and progressing to specific diagnoses based on diagnostic criteria.
* The pink arrows indicate possible progressions or relationships between stages.
* The light blue boxes represent symptoms, findings, or criteria, while the light gray boxes represent diagnostic categories.
### Interpretation
The flow diagram provides a visual representation of the diagnostic pathway for Acute Coronary Syndrome (ACS). It highlights the importance of considering various symptoms, findings, and diagnostic criteria in order to arrive at an accurate diagnosis. The diagram suggests that the diagnostic process involves a series of assessments and evaluations, with the ultimate goal of classifying the patient's condition into one of several categories: STEMI-ACS, NSTEMI-ACS, NSTE-ACS, or UA. The pink arrows indicate that the diagnostic process is not always linear and that there may be multiple possible pathways to a final diagnosis.