# Technical Document Extraction: ADP-MA Replay Mode Interface
This document provides a comprehensive extraction of the textual and structural data from the provided image of the **ADP-MA** software interface.
## 1. Header Information
* **Application Name:** ADP-MA (accompanied by a purple icon with "MA").
* **Mode Selection:**
* **Live Mode:** Inactive (indicated by grey text and radio icon).
* **Replay Mode:** Active (indicated by a blue highlighted button with a refresh icon).
* **Utility Icons:** Document icon and GitHub logo (top right).
## 2. Page Title and Description
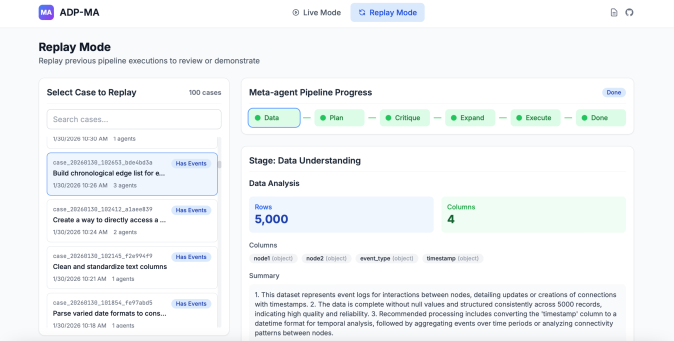
* **Title:** Replay Mode
* **Description:** Replay previous pipeline executions to review or demonstrate.
---
## 3. Component Isolation: Left Sidebar (Case Selection)
This section allows the user to select a specific historical execution.
* **Section Header:** Select Case to Replay
* **Case Count:** 100 cases
* **Search Bar:** Placeholder text "Search cases..."
* **Case List (Scrollable):**
| Case ID | Status Tag | Description | Timestamp | Agent Count |
| :--- | :--- | :--- | :--- | :--- |
| `case_20260130_102653_bde4bd3a` | Has Events (Blue) | Build chronological edge list for e... | 1/30/2026 10:26 AM | 3 agents |
| `case_20260130_102412_a1aee839` | Has Events (Blue) | Create a way to directly access a ... | 1/30/2026 10:24 AM | 2 agents |
| `case_20260130_102145_f2e994f9` | Has Events (Blue) | Clean and standardize text columns | 1/30/2026 10:21 AM | 1 agents |
| `case_20260130_101854_fe97abd5` | Has Events (Blue) | Parse varied date formats to cons... | 1/30/2026 10:18 AM | 1 agents |
---
## 4. Component Isolation: Main Content Area (Pipeline Details)
### 4.1 Meta-agent Pipeline Progress
This is a horizontal flow diagram showing the stages of the pipeline. All stages are marked with a green dot, indicating completion.
* **Status Indicator:** Done (Blue pill button)
* **Flow Sequence:**
1. **Data** (Highlighted with a blue border, indicating current view)
2. **Plan**
3. **Critique**
4. **Expand**
5. **Execute**
6. **Done**
### 4.2 Stage Details: Data Understanding
This section provides a technical breakdown of the data processed in the "Data" stage.
* **Sub-header:** Stage: Data Understanding
* **Section:** Data Analysis
* **Data Metrics:**
* **Rows:** 5,000 (Displayed in a blue box)
* **Columns:** 4 (Displayed in a green box)
* **Column Schema:**
* `node1` (object)
* `node2` (object)
* `event_type` (object)
* `timestamp` (object)
### 4.3 Summary Text
The following text is transcribed from the "Summary" block:
1. This dataset represents event logs for interactions between nodes, detailing updates or creations of connections with timestamps.
2. The data is complete without null values and structured consistently across 5000 records, indicating high quality and reliability.
3. Recommended processing includes converting the 'timestamp' column to a datetime format for temporal analysis, followed by aggregating events over time periods or analyzing connectivity patterns between nodes.