# Technical Document Extraction: Pipeline Replay Interface
## Header Section
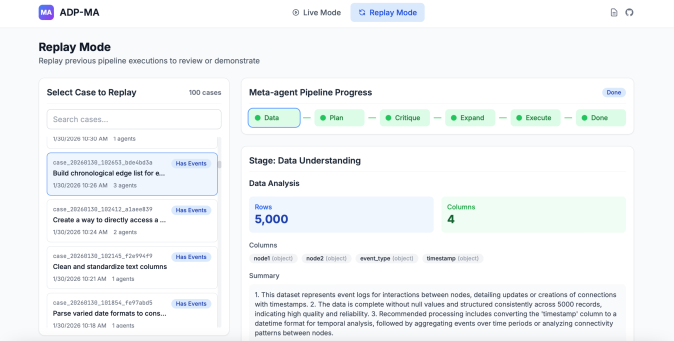
- **Title**: `ADP-MA`
- **Mode Selection**:
- `Live Mode` (default)
- `Replay Mode` (active, highlighted in blue)
## Left Panel: Case Selection
### Title: `Replay Mode`
- **Description**: "Replay previous pipeline executions to review or demonstrate"
- **Search Bar**: `Search cases...`
- **Case List**:
1. **Case ID**: `20240139_102651_bda4b3a`
- **Timestamp**: `1/30/2020 10:30 AM`
- **Agents**: `3 agents`
- **Status**: `Has Events`
- **Description**: `Build chronological edge list for...`
2. **Case ID**: `20240139_102412_alae839`
- **Timestamp**: `1/30/2020 10:24 AM`
- **Agents**: `2 agents`
- **Status**: `Has Events`
- **Description**: `Create a way to directly access a...`
3. **Case ID**: `20240139_102145_f2e994f9`
- **Timestamp**: `1/30/2020 10:21 AM`
- **Agents**: `1 agent`
- **Status**: `Has Events`
- **Description**: `Clean and standardize text columns`
4. **Case ID**: `20240139_101854_fe97and5`
- **Timestamp**: `1/30/2020 10:18 AM`
- **Agents**: `1 agent`
- **Status**: `Has Events`
- **Description**: `Parse parsed date formats to data...`
## Right Panel: Pipeline Progress
### Title: `Meta-agent Pipeline Progress`
- **Stages**:
1. `Data Understanding` (✅ Completed)
2. `Critique` (✅ Completed)
3. `Expand` (✅ Completed)
4. `Execute` (✅ Completed)
5. `Done` (✅ Completed)
### Stage Details: `Data Understanding`
- **Data Analysis**:
- **Rows**: `5,000`
- **Columns**: `4`
- `node1 (object)`
- `node2 (object)`
- `event_type (object)`
- `timestamp (object)`
- **Summary**:
> "This dataset represents event logs for interactions between nodes, detailing updates or creations of connections with timestamps. 2. The data is complete without null values and structured consistently across 5000 records, indicating high quality and reliability. 3. Recommended processing includes converting the 'timestamp' column to a datetime format for temporal analysis, followed by aggregating events over time periods or analyzing connectivity patterns between nodes."
## Color Legend
- **Pipeline Stages**: Green circles with checkmarks (✅) indicate completed stages.
- **Data Table**:
- **Rows**: Blue box (`5,000`)
- **Columns**: Green box (`4`)
## Spatial Grounding
- **Legend Position**: Top-right corner (implied by stage progression flow).
- **Color Consistency**:
- All completed stages use green (`#4CAF50`).
- Data table rows/columns use blue/green for emphasis.
## Trend Verification
- **Pipeline Flow**: Linear progression from left to right (Data Understanding → Done).
- **Data Structure**: Static values (5,000 rows, 4 columns) with no temporal trends.
## Component Isolation
1. **Header**: Mode selection and title.
2. **Main Chart**: Pipeline stages with completion indicators.
3. **Footer**: No explicit footer; summary text under "Data Understanding."
## Language Notes
- **Primary Language**: English.
- **No additional languages detected.**