## Neural Network Diagram: Perception and Logical Layers
### Overview
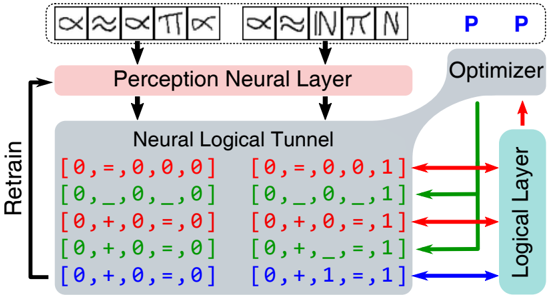
The image is a diagram illustrating a neural network architecture, focusing on the interaction between a perception neural layer, a neural logical tunnel, and a logical layer. It shows how input symbols are processed through these layers, with an optimizer and a retraining loop involved.
### Components/Axes
* **Top:** Input symbols enclosed in a dashed box. The symbols include mathematical symbols like alpha (α), approximately equal to (≈), pi (π), and the letters I and N. There are two "P" labels to the right of the symbols.
* **Perception Neural Layer:** A red block labeled "Perception Neural Layer" receives input from the symbols.
* **Neural Logical Tunnel:** A grey area labeled "Neural Logical Tunnel" receives input from the Perception Neural Layer. Inside this tunnel are several bracketed expressions containing numbers (0, 1) and symbols (=, +, \_). These expressions are color-coded in red, green, and blue.
* **Logical Layer:** A light blue block labeled "Logical Layer" interacts with the Neural Logical Tunnel and an "Optimizer" block.
* **Optimizer:** A grey block labeled "Optimizer" interacts with the Logical Layer.
* **Retrain:** A black arrow labeled "Retrain" loops from the output of the Neural Logical Tunnel back to the input of the Perception Neural Layer.
* **Arrows:** Red, green, and blue arrows indicate the flow of information between the Neural Logical Tunnel and the Logical Layer.
### Detailed Analysis
* **Input Symbols:** The input consists of a sequence of symbols: α, ≈, α, π, α, ≈, I, N, π, N. These symbols are fed into the Perception Neural Layer.
* **Perception Neural Layer:** This layer processes the input symbols and passes the information to the Neural Logical Tunnel.
* **Neural Logical Tunnel:** This layer contains a series of expressions. The expressions are arranged in two columns.
* **Left Column:**
* `[0, =, 0, 0, 0]` (Red)
* `[0, _, 0, _, 0]` (Red)
* `[0, +, 0, =, 0]` (Red)
* `[0, +, 0, =, 0]` (Green)
* `[0, +, 0, =, 0]` (Blue)
* **Right Column:**
* `[0, =, 0, 0, 1]` (Red)
* `[0, _, 0, _, 1]` (Red)
* `[0, +, 0, =, 1]` (Red)
* `[0, +, _, =, 1]` (Green)
* `[0, +, 1, =, 1]` (Blue)
* **Logical Layer:** This layer receives input from the Neural Logical Tunnel and interacts with the Optimizer.
* **Optimizer:** The Optimizer likely adjusts the parameters of the network based on the output of the Logical Layer.
* **Retrain Loop:** The "Retrain" arrow indicates that the network is trained iteratively, with the output of the Neural Logical Tunnel influencing the Perception Neural Layer in subsequent iterations.
* **Color-Coded Arrows:**
* Red arrows connect the first three expressions in each column of the Neural Logical Tunnel to the Logical Layer.
* Green arrows connect the fourth expression in each column to the Logical Layer.
* Blue arrows connect the fifth expression in each column to the Logical Layer.
### Key Observations
* The diagram illustrates a complex interaction between different layers of a neural network.
* The Neural Logical Tunnel appears to be a key component, processing information and providing feedback for retraining.
* The color-coding suggests different pathways or types of information flow within the network.
### Interpretation
The diagram depicts a neural network designed to process symbolic input, potentially for tasks involving logical reasoning or pattern recognition. The Perception Neural Layer likely extracts features from the input symbols, while the Neural Logical Tunnel performs some form of logical inference or transformation. The Logical Layer then makes a decision or prediction based on this processed information. The Optimizer and Retrain loop enable the network to learn and improve its performance over time. The color-coding could represent different logical pathways or confidence levels associated with different inferences. The specific meaning of the expressions within the Neural Logical Tunnel would depend on the details of the network's implementation and training data.