\n
## Line Chart: Mean Pass Rate vs. Mean Number of Tokens Generated
### Overview
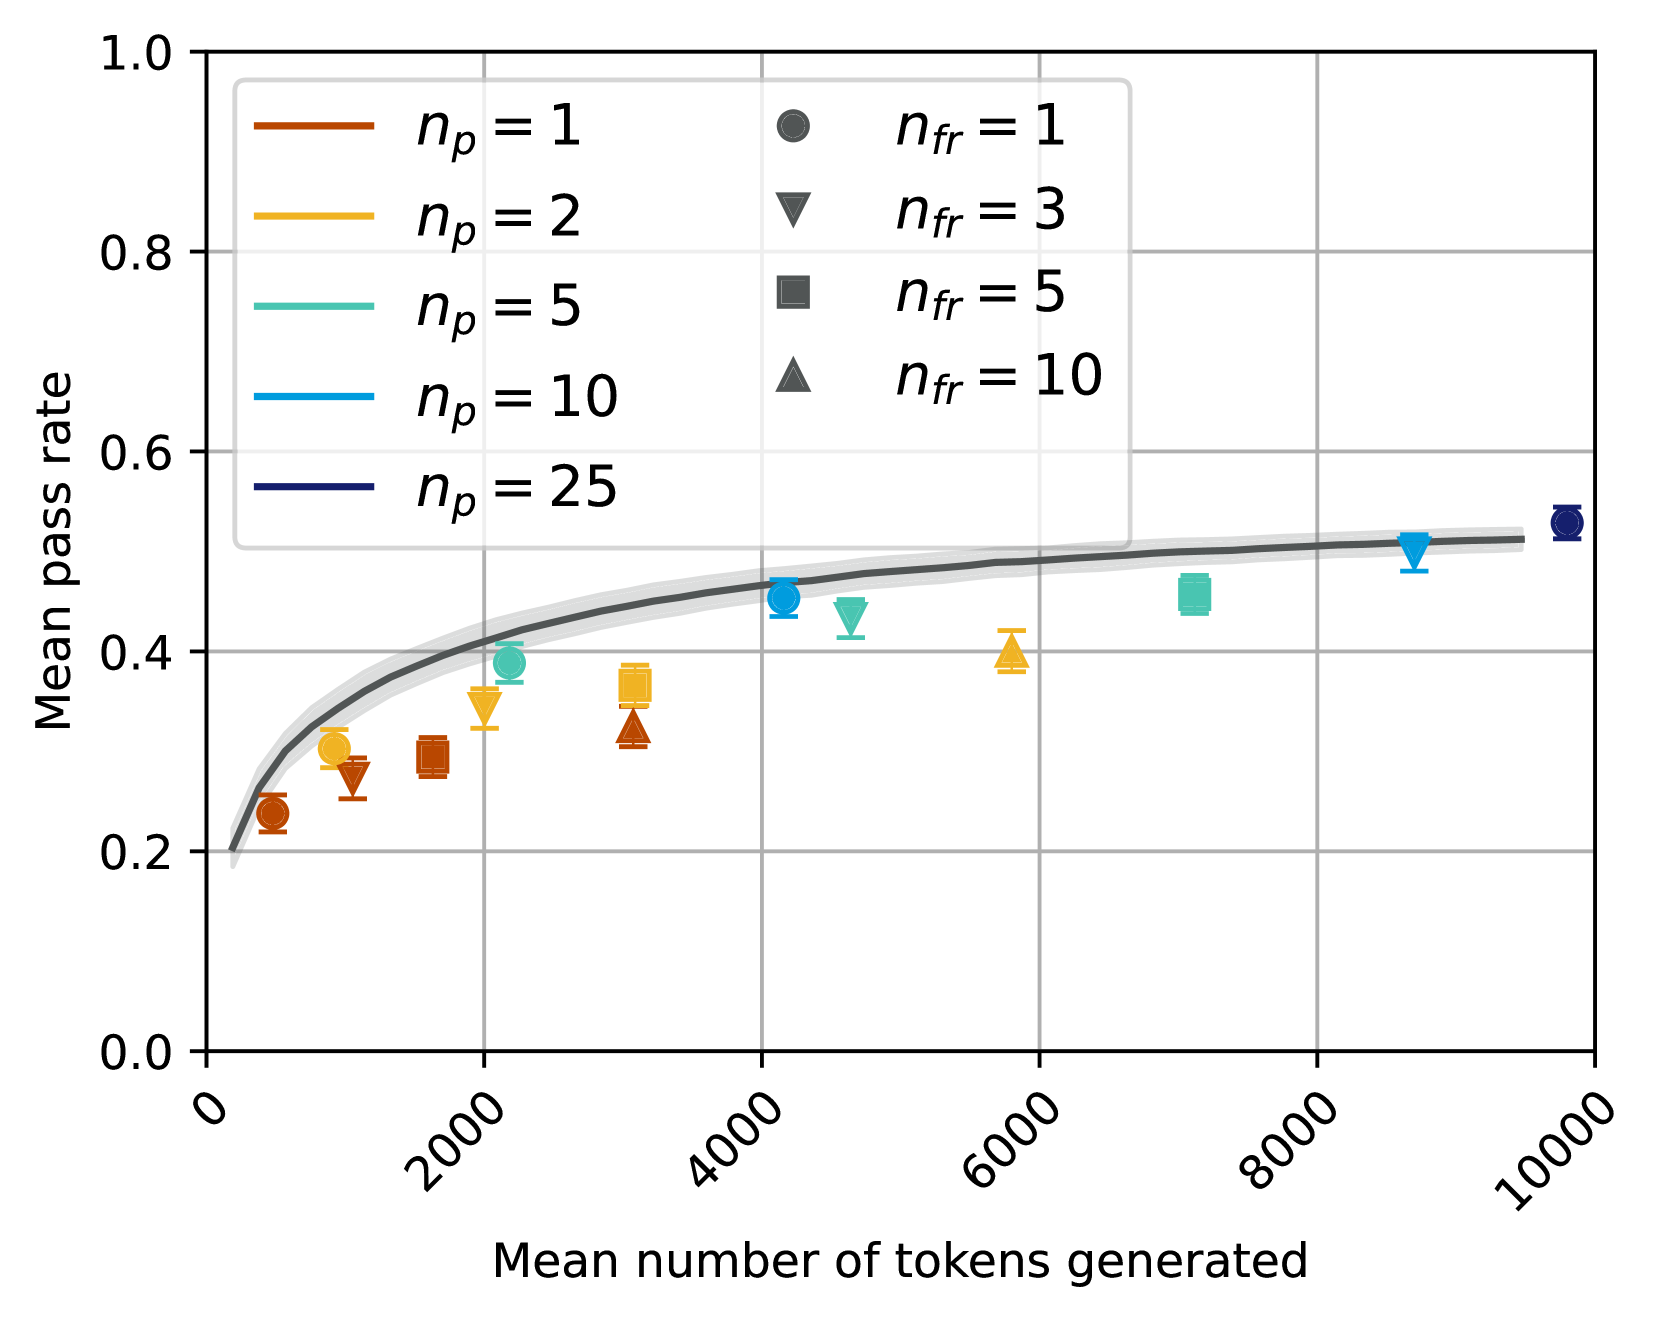
This chart displays the relationship between the mean number of tokens generated and the mean pass rate, for different values of *n<sub>p</sub>* and *n<sub>fr</sub>*. The chart uses line plots with shaded confidence intervals, and also includes individual data points for *n<sub>fr</sub>* = 1, 3, 5, and 10. The x-axis represents the mean number of tokens generated, and the y-axis represents the mean pass rate.
### Components/Axes
* **X-axis Title:** "Mean number of tokens generated" (Scale: 0 to 10000, approximately)
* **Y-axis Title:** "Mean pass rate" (Scale: 0.0 to 1.0, approximately)
* **Lines/Data Series:**
* *n<sub>p</sub>* = 1 (Brown)
* *n<sub>p</sub>* = 2 (Orange)
* *n<sub>p</sub>* = 5 (Light Green)
* *n<sub>p</sub>* = 10 (Cyan)
* *n<sub>p</sub>* = 25 (Purple)
* **Data Points:**
* *n<sub>fr</sub>* = 1 (Gray Circle)
* *n<sub>fr</sub>* = 3 (Dark Red Downward Triangle)
* *n<sub>fr</sub>* = 5 (Dark Blue Square)
* *n<sub>fr</sub>* = 10 (Dark Green Upward Triangle)
* **Legend:** Located in the top-right corner of the chart.
### Detailed Analysis
The chart shows five lines representing different values of *n<sub>p</sub>*. Each line is accompanied by a shaded region, presumably representing a confidence interval. Additionally, there are individual data points plotted for different values of *n<sub>fr</sub>*.
* **n<sub>p</sub> = 1 (Brown):** The line starts at approximately (0, 0.2) and increases slowly, reaching approximately (9000, 0.5).
* **n<sub>p</sub> = 2 (Orange):** The line starts at approximately (0, 0.2) and increases, reaching approximately (9000, 0.5).
* **n<sub>p</sub> = 5 (Light Green):** The line starts at approximately (0, 0.3) and increases, reaching approximately (9000, 0.55).
* **n<sub>p</sub> = 10 (Cyan):** The line starts at approximately (0, 0.35) and increases, reaching approximately (9000, 0.55).
* **n<sub>p</sub> = 25 (Purple):** The line starts at approximately (0, 0.4) and increases, reaching approximately (9000, 0.6).
**Data Points:**
* *n<sub>fr</sub>* = 1 (Gray Circle):
* (0, 0.2)
* (9000, 0.5)
* *n<sub>fr</sub>* = 3 (Dark Red Downward Triangle):
* (2000, 0.35)
* (6000, 0.4)
* *n<sub>fr</sub>* = 5 (Dark Blue Square):
* (4000, 0.4)
* (8000, 0.5)
* *n<sub>fr</sub>* = 10 (Dark Green Upward Triangle):
* (4000, 0.45)
* (9000, 0.55)
The lines generally show an upward trend, indicating that as the mean number of tokens generated increases, the mean pass rate also tends to increase. The lines for higher values of *n<sub>p</sub>* are consistently above those for lower values.
### Key Observations
* The lines for different *n<sub>p</sub>* values converge at lower token counts and diverge at higher token counts.
* The data points for *n<sub>fr</sub>* generally fall within the confidence intervals of the corresponding *n<sub>p</sub>* lines.
* The confidence intervals become wider as the number of tokens generated increases, indicating greater uncertainty in the pass rate at higher token counts.
* The pass rate appears to plateau around 0.5-0.6 for most values of *n<sub>p</sub>*.
### Interpretation
The chart suggests that increasing the number of tokens generated generally leads to a higher pass rate, but the effect diminishes at higher token counts. The parameter *n<sub>p</sub>* appears to have a positive influence on the pass rate, with higher values of *n<sub>p</sub>* resulting in higher pass rates. The parameter *n<sub>fr</sub>* seems to represent specific data points that validate the trend observed in the lines for different *n<sub>p</sub>* values.
The convergence of the lines at lower token counts suggests that the effect of *n<sub>p</sub>* is less pronounced when the number of tokens generated is small. As the number of tokens generated increases, the differences between the lines become more apparent, indicating that *n<sub>p</sub>* plays a more significant role in determining the pass rate at higher token counts.
The widening confidence intervals at higher token counts suggest that the pass rate becomes more variable as the number of tokens generated increases. This could be due to a variety of factors, such as increased complexity of the generated text or limitations in the evaluation metric. The plateauing of the pass rate around 0.5-0.6 suggests that there may be an upper limit to the pass rate that can be achieved, regardless of the number of tokens generated or the value of *n<sub>p</sub>*.