## Network Diagram: Complex Interconnections
### Overview
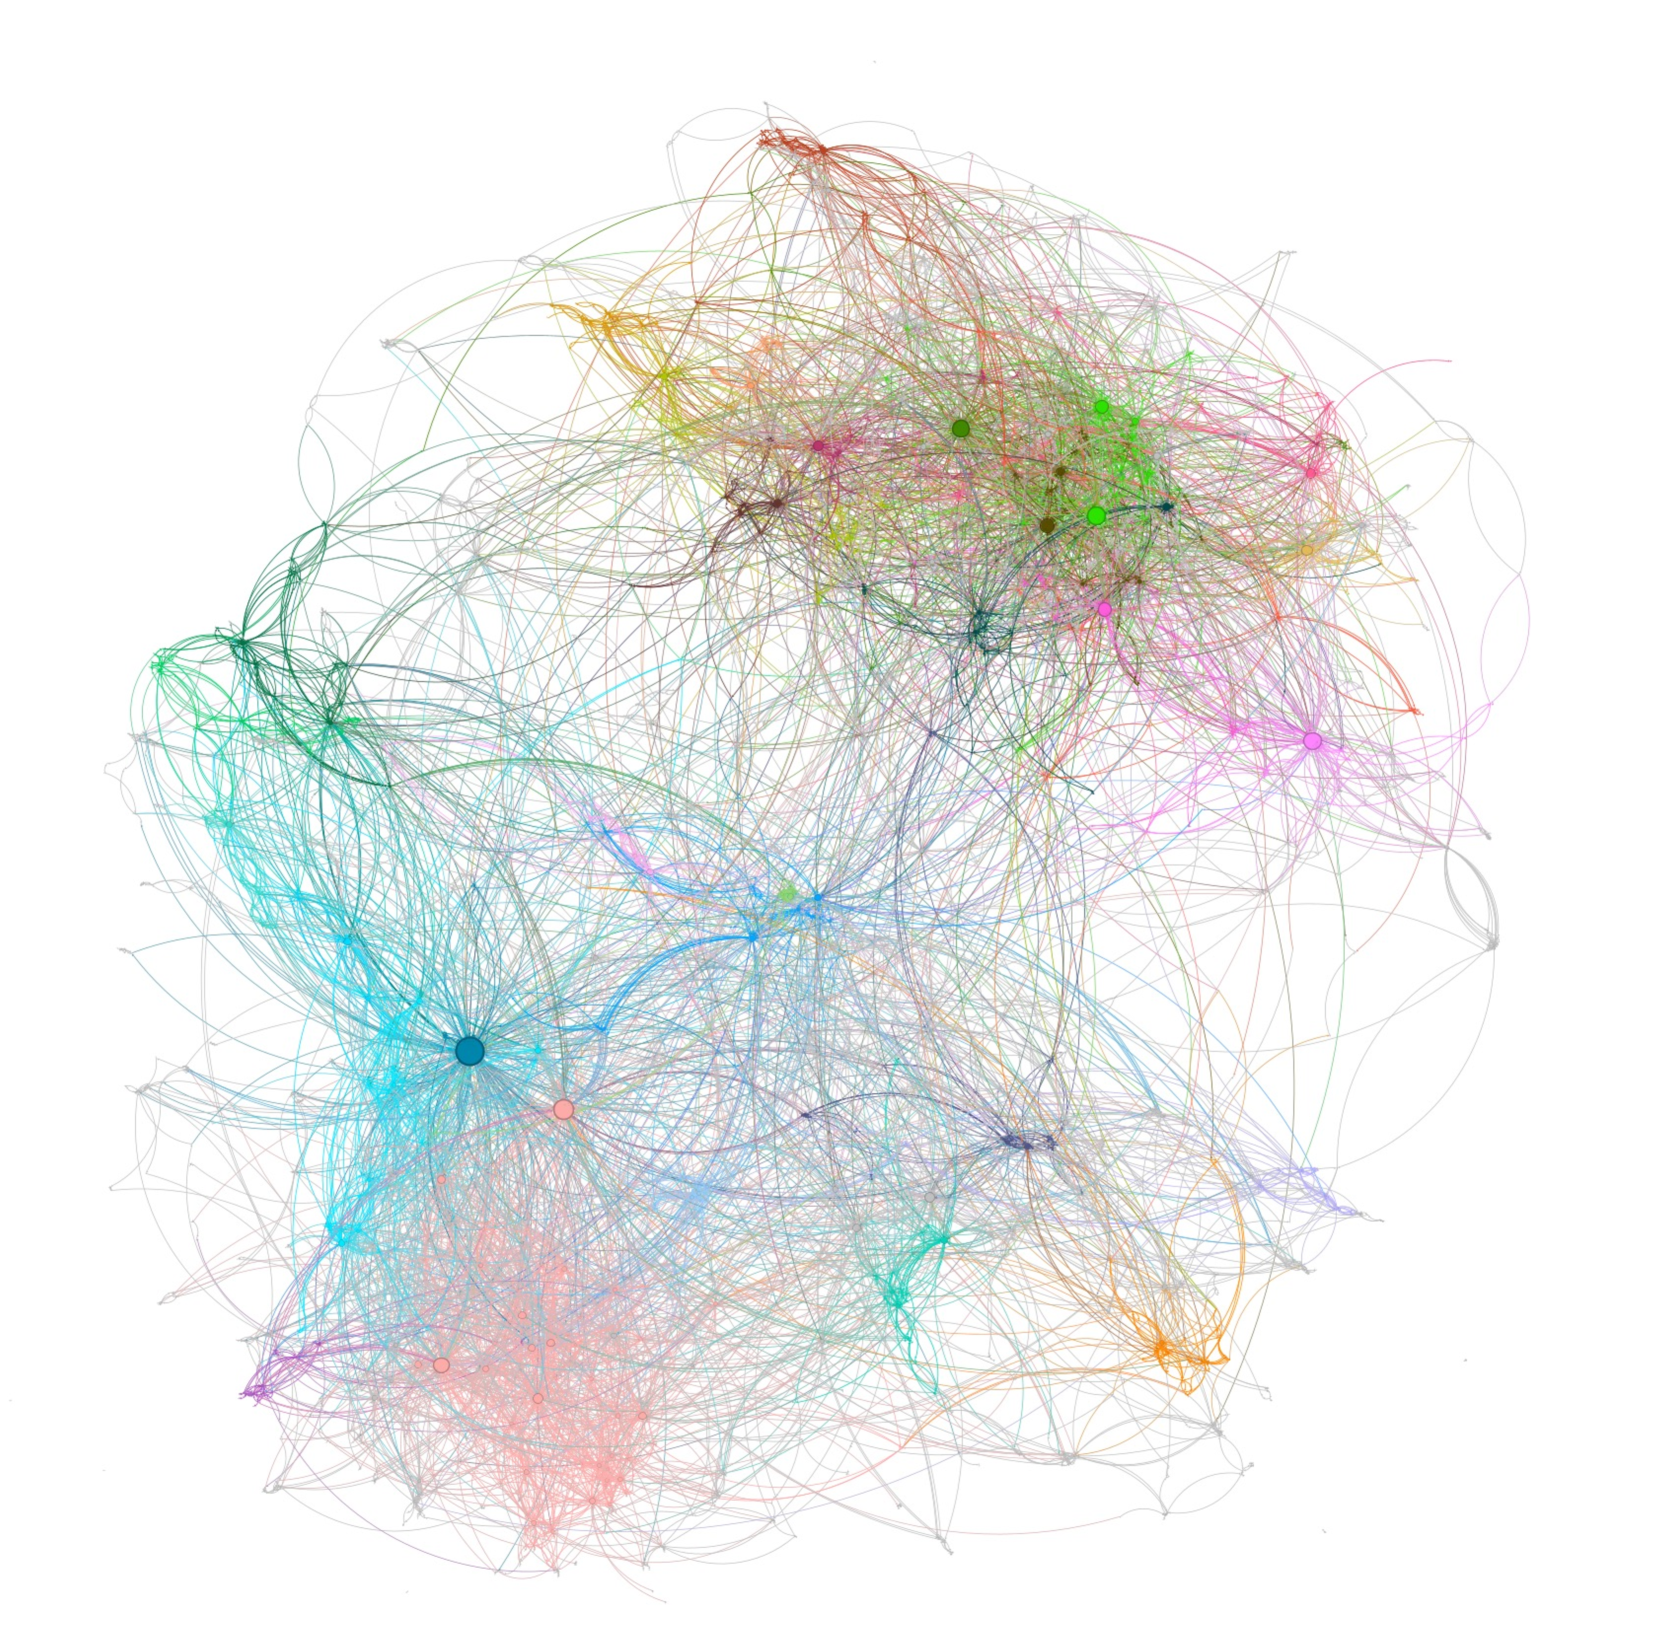
The image is a network diagram illustrating complex interconnections between various nodes. The nodes are represented by colored circles, and the connections between them are shown as lines of corresponding colors. The diagram is densely populated with connections, indicating a high degree of interaction between the nodes.
### Components/Axes
* **Nodes:** Represented by colored circles. The size of the circles varies, suggesting different levels of importance or activity.
* **Edges:** Represented by colored lines connecting the nodes. The colors of the lines correspond to the colors of the nodes they connect, indicating the type or category of relationship.
* **Colors:** Multiple colors are used to differentiate between different groups or categories of nodes and their connections. The colors observed include red, orange, green, light blue, dark blue, pink, purple, and gray.
### Detailed Analysis
The network diagram consists of several clusters of nodes, each characterized by a dominant color. The connections within each cluster are dense, while the connections between clusters are less frequent.
* **Top Cluster:** Dominated by red, orange, and green connections. This cluster appears to be highly interconnected, with many nodes linked to each other.
* **Left Cluster:** Dominated by green and light blue connections. This cluster is also densely connected, with a central node having numerous connections to other nodes in the cluster.
* **Bottom Cluster:** Dominated by pink and light red connections. This cluster is less dense than the others, with fewer connections between the nodes.
* **Central Area:** A mix of all colors, indicating connections between all clusters.
The nodes vary in size. Some nodes are larger, suggesting they may be more central or influential within the network. The lines also vary in thickness, possibly indicating the strength or frequency of the connection.
### Key Observations
* The network is highly interconnected, with multiple clusters of nodes.
* The colors of the nodes and connections indicate different categories or types of relationships.
* The size of the nodes and the thickness of the lines may represent the importance or strength of the connections.
* There are a few larger nodes that appear to be central hubs within the network.
### Interpretation
The network diagram likely represents a complex system with multiple interacting components. The clusters of nodes may represent different groups or categories within the system, while the connections between them indicate the relationships and interactions between these groups. The larger nodes may represent key players or influential factors within the system.
The diagram suggests that the system is highly interconnected, with a high degree of interaction between the different components. This could indicate a complex and dynamic system, where changes in one part of the system can have ripple effects throughout the entire network.
Without additional context or information, it is difficult to determine the specific meaning of the diagram. However, the visual representation provides a valuable overview of the structure and relationships within the system.