## Network Graph: Complex System Topology
### Overview
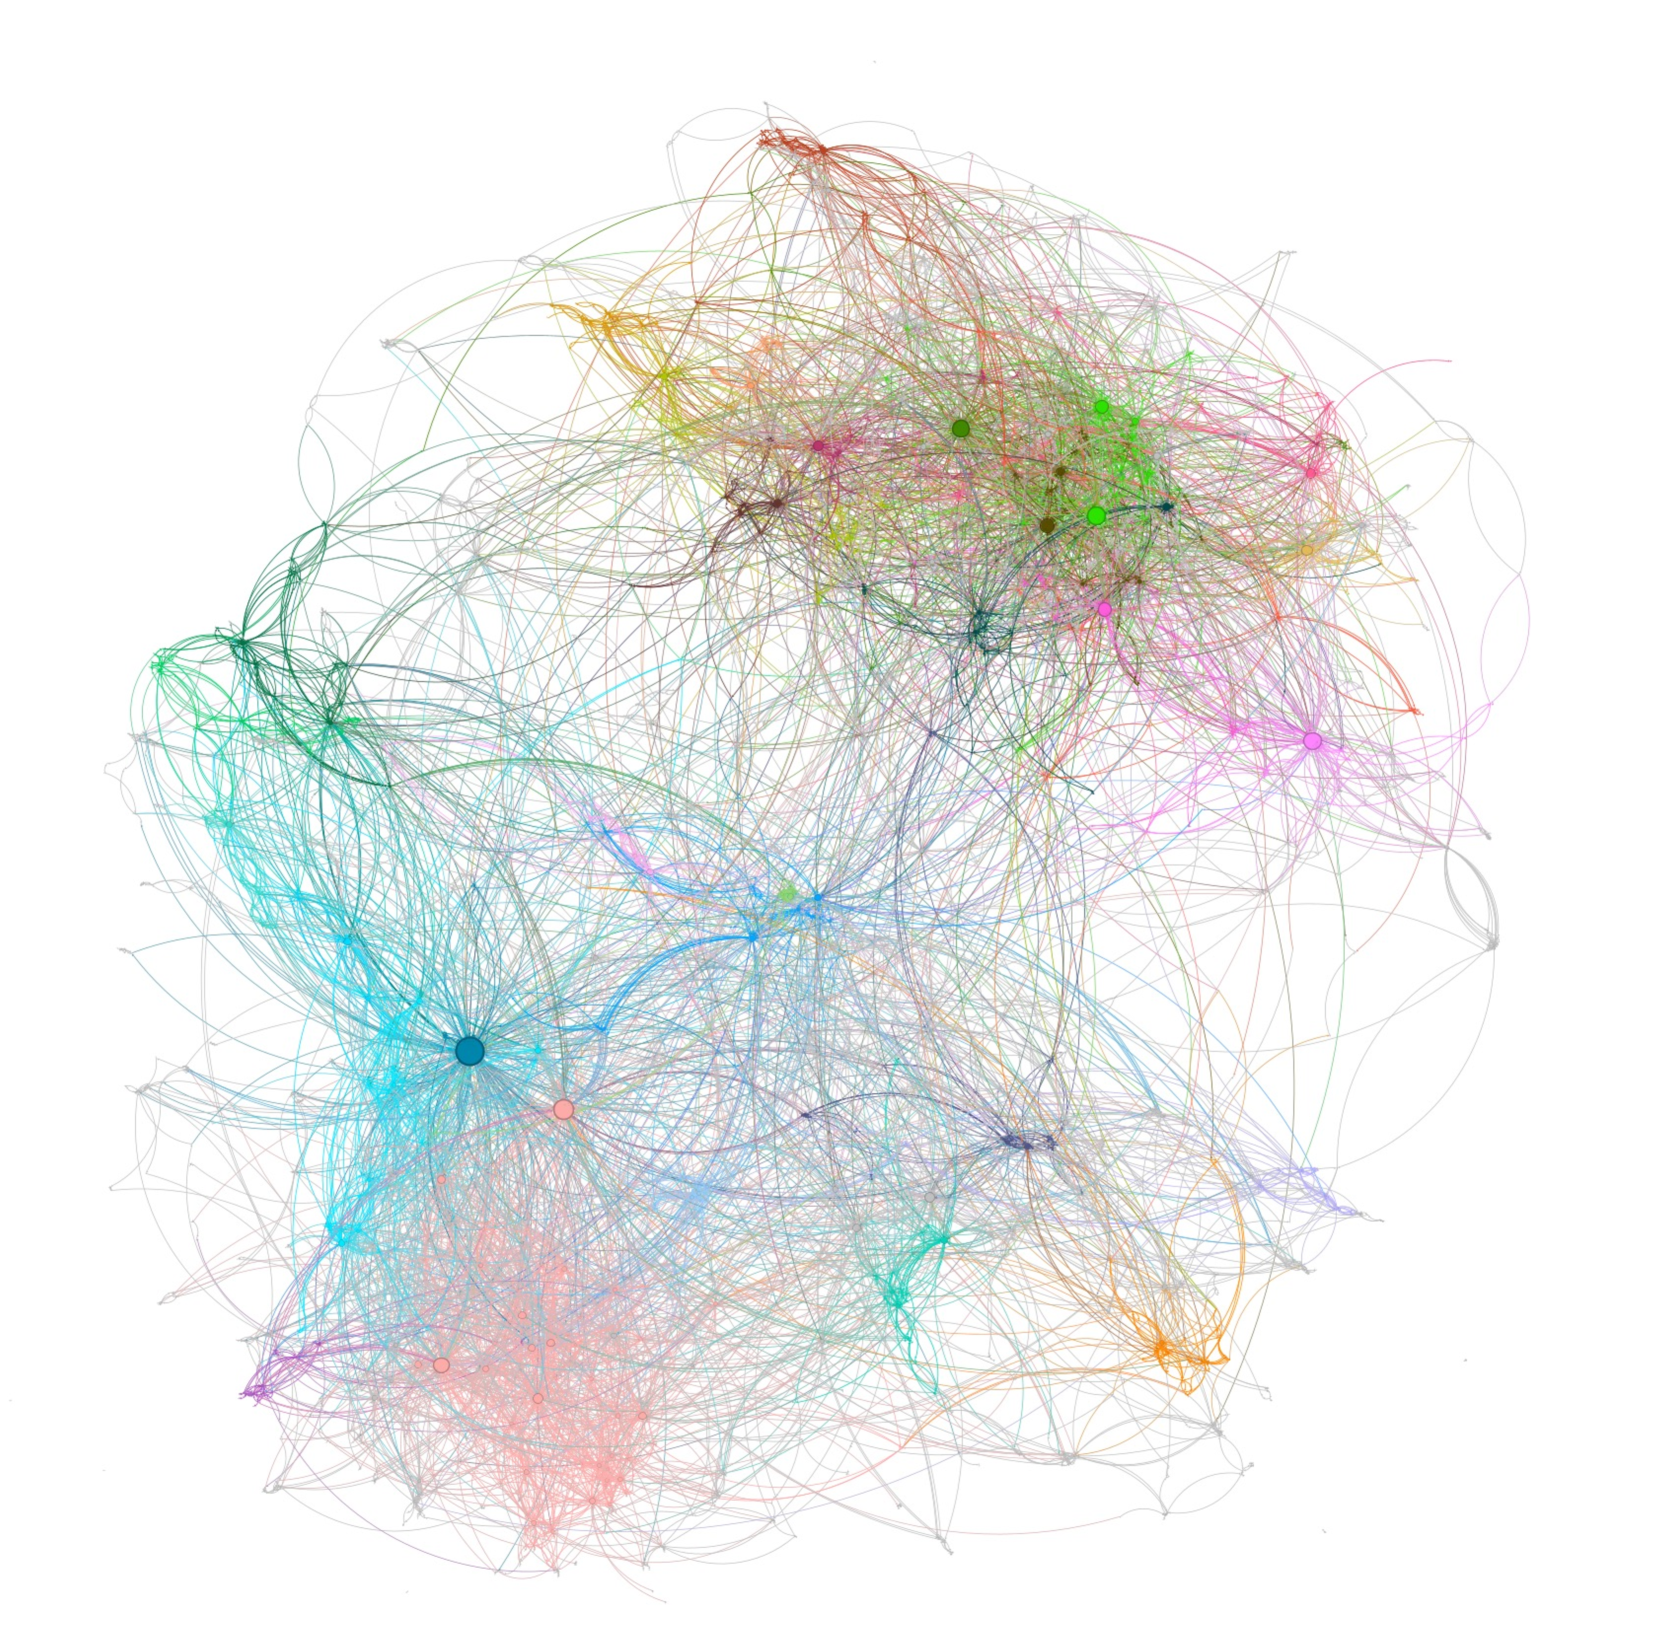
The image is a high-density, force-directed network graph visualization. It represents a complex system of interconnected entities (nodes) and their relationships (edges). There is no textual information, axis labels, or legends provided in the image. The visualization relies on spatial positioning and color-coding to denote community structure, node centrality, and network density.
### Components/Axes
* **Axes:** None. This is a topological representation, not a Cartesian plot. Spatial positioning is determined by the force-directed algorithm (nodes with high connectivity are pulled together; nodes with low connectivity are pushed to the periphery).
* **Nodes:** Represent individual entities.
* **Size:** Variable. Larger nodes indicate higher degree centrality (more connections).
* **Color:** Categorical. Colors appear to represent distinct communities, clusters, or types of entities.
* **Edges:** Represent relationships or dependencies between nodes. They are rendered as thin, semi-transparent lines, creating a "web" effect.
* **Layout:** Force-directed (likely Fruchterman-Reingold or similar), where the graph is self-organizing based on the strength of connections.
### Detailed Analysis
The graph can be segmented into four primary regions based on visual density and color clustering:
1. **Top-Center Cluster (Green/Brown/Yellow):**
* **Density:** Extremely high. This is the most densely packed region of the graph.
* **Composition:** Dominated by green and brown nodes. There is a high degree of overlap, suggesting a "core" or highly interconnected community.
* **Trend:** The edges here are short and numerous, indicating a high local clustering coefficient.
2. **Mid-Left Cluster (Blue/Cyan):**
* **Density:** Moderate to High.
* **Composition:** Dominated by a single, large, dark blue hub node located in the mid-left region. This hub acts as a primary connector for a large sub-network of cyan and light blue nodes.
* **Trend:** The edges radiate outward from the central blue hub, creating a "star" or "hub-and-spoke" sub-structure within the larger graph.
3. **Bottom Cluster (Pink/Light Red):**
* **Density:** Moderate.
* **Composition:** A distinct cluster of pink and light red nodes.
* **Trend:** This cluster is somewhat separated from the top-center core but maintains significant connectivity to the central "bridge" nodes.
4. **Peripheral/Bridge Nodes:**
* **Density:** Low.
* **Composition:** Scattered nodes of various colors (orange, purple, light blue) located on the outer edges of the graph.
* **Trend:** These nodes have fewer connections and act as bridges between the major clusters, maintaining the global connectivity of the network.
### Key Observations
* **Hubs:** There are several "super-nodes" (notably the large blue node on the left and a few green nodes in the top cluster) that possess significantly higher degree centrality than the surrounding nodes.
* **Modularity:** The graph exhibits strong modularity. The color-coding clearly delineates distinct communities that are internally dense but externally sparse.
* **Small-World Property:** Despite the distinct clusters, the graph is highly connected. There are no isolated components; every node is part of the single, giant connected component.
* **Edge Density:** The center of the image is the most visually "noisy" due to the high volume of overlapping edges, indicating that the central nodes serve as the primary conduits for information or flow between the disparate clusters.
### Interpretation
This visualization is a structural map of a complex system. Without labels, we can infer the nature of the data through its topology:
* **What the data demonstrates:** This is likely a representation of a social network, a citation network, or a software dependency graph. The force-directed layout reveals the "community structure" of the data.
* **Peircean Investigative Analysis:**
* **The Icon:** The visual shape of the graph (the "hairball" structure) is an icon of complexity. It suggests a system with many moving parts where local interactions (clusters) are as important as global connectivity (the bridges).
* **The Index:** The clusters are indices of "homophily"—the tendency of similar entities to connect with one another. The large hubs are indices of "influence" or "criticality."
* **The Symbol:** The colors are symbolic. They likely represent metadata (e.g., user demographics, file types, or research topics) that the algorithm has mapped onto the structural topology.
* **Reading between the lines:** The presence of distinct, color-coded clusters suggests that the system is not homogeneous. It is a collection of specialized sub-groups that interact through specific "bridge" nodes. If this were a social network, the large blue hub on the left might represent a central influencer or a specific platform/group that connects a large, otherwise distinct, sub-community to the rest of the network. The high density at the top suggests a "core" group that is highly collaborative or interdependent.