\n
## Network Graph: Complex Interconnection Diagram
### Overview
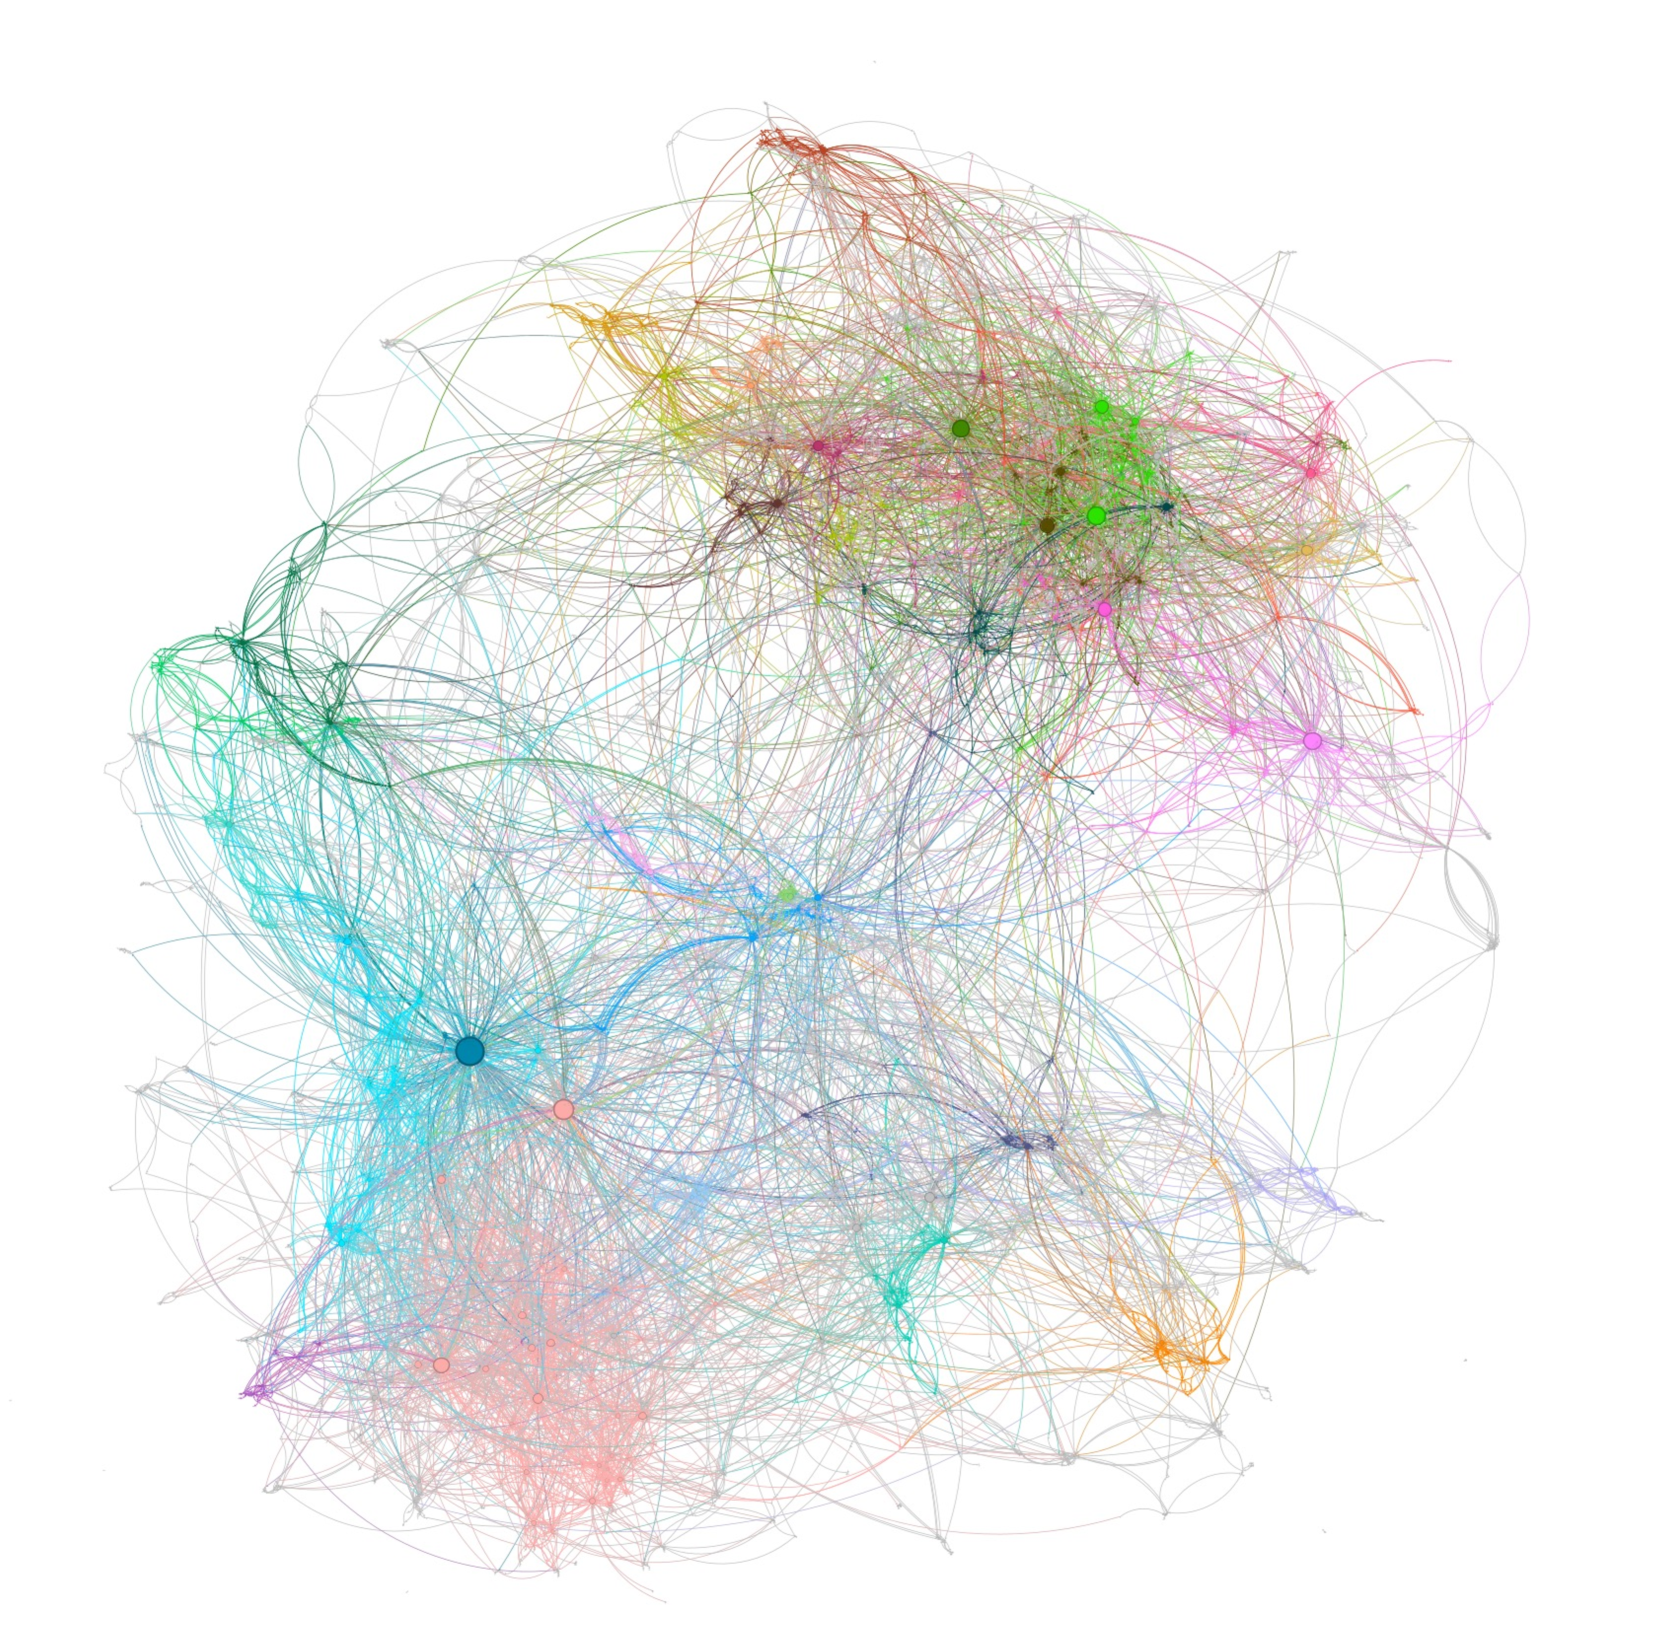
The image depicts a complex network graph with numerous nodes connected by edges. The nodes vary in size and are colored, suggesting different categories or importance. The overall structure appears somewhat clustered, with several distinct groups of nodes exhibiting denser connections within the group than between groups. There are no explicit axes or labels present in the image itself. The graph is presented on a white background.
### Components/Axes
There are no explicit axes or scales. The components are nodes (circles) and edges (lines connecting the nodes). Node size appears to correlate with some metric, potentially degree centrality or node weight. Node color is used to differentiate groups or categories.
### Detailed Analysis or Content Details
Due to the density and lack of labels, precise numerical data extraction is impossible. However, we can describe the visual characteristics and approximate groupings:
* **Color Clusters:**
* **Light Blue/Cyan Cluster (Bottom-Left):** This is the largest cluster, with many nodes and edges. The nodes are predominantly light blue and cyan.
* **Pink/Peach Cluster (Bottom):** A smaller cluster, primarily pink and peach colored.
* **Green Cluster (Top-Right):** A moderately sized cluster, with nodes in various shades of green. This cluster appears to have a higher density of connections than the others.
* **Purple/Lavender Cluster (Top):** A smaller cluster, with nodes in shades of purple and lavender.
* **Orange/Brown Cluster (Top-Right):** A smaller cluster, with nodes in shades of orange and brown.
* **Mixed Color Areas:** There are areas where nodes of different colors are interconnected, suggesting relationships between the clusters.
* **Node Size:**
* There are a few larger nodes (diameter approximately 5-8 pixels) scattered throughout the graph, particularly within the blue, green, and purple clusters. These likely represent more significant nodes within the network.
* The majority of nodes are smaller (diameter approximately 2-3 pixels).
* **Edge Density:**
* The green cluster exhibits the highest edge density, with many lines connecting the nodes.
* The blue cluster has a moderate edge density.
* The pink, purple, and orange clusters have lower edge densities.
* **Edge Distribution:**
* Edges are distributed seemingly randomly, but with a clear tendency to connect nodes within the same color cluster.
* There are numerous edges connecting nodes across different clusters, indicating inter-cluster relationships.
### Key Observations
* The network is highly interconnected, with a large number of edges.
* The blue cluster is the most extensive, suggesting it may represent the core of the network.
* The green cluster is the most densely connected, indicating strong relationships within that group.
* The varying node sizes suggest a hierarchical structure or differing importance of nodes.
* The lack of labels makes it difficult to interpret the meaning of the nodes and edges.
### Interpretation
This network graph likely represents a complex system of relationships between entities. The nodes could represent individuals, organizations, concepts, or any other type of entity. The edges represent the connections or interactions between these entities.
The clustering suggests that the entities can be grouped into distinct communities or categories. The varying node sizes and edge densities indicate that some entities and relationships are more important or influential than others.
Without labels, it is impossible to determine the specific meaning of the graph. However, the visual patterns suggest that the system is highly interconnected and that there are strong relationships within and between different groups. The graph could be used to visualize social networks, knowledge graphs, biological networks, or any other type of complex system.
The absence of quantitative data (e.g., edge weights, node attributes) limits the depth of analysis. Further investigation would require access to the underlying data and a clear understanding of the entities and relationships represented by the graph. The image is a visualization of relationships, but lacks the factual data to provide a definitive interpretation.